


What is the NAPLAN?
The National Assessment Program – Literacy and Numeracy (NAPLAN) is a nationwide assessment conducted annually in Australia for students in Years 3, 5, 7, and 9. It tests foundational skills in reading, writing, language conventions (spelling, grammar and punctuation), and numeracy.
NAPLAN is not a test of content knowledge, but rather a measure of how well students can apply skills in literacy and numeracy that are developed over time through the school curriculum. The results are used by governments, schools, and educators to evaluate educational programs and track student progress at a national level.
Why is it done at Year 3?
Year 3 is the first point at which students participate in NAPLAN testing. By this stage, students have had three full years of formal schooling and are expected to have developed fundamental literacy and numeracy skills.
The assessment serves several purposes at this level:
- Early identification of students who may need additional support.
- A baseline for progress tracking across future years (e.g., comparing Year 3 to Year 5).
- Insight for schools and policymakers into how students are performing system-wide in the early years of learning.
For parents, Year 3 NAPLAN results provide the first national-level indication of how their child is progressing relative to peers across the country.
What are the proficiency levels?
As of 2023, NAPLAN results are reported using proficiency levels rather than numerical bands. These levels are designed to provide clearer insights into a student’s development and where they sit in relation to national expectations.
There are four proficiency levels:
- Exceeding – The student demonstrates skills well above the expected level for their year.
- Strong – The student demonstrates solid understanding and skills at or above expectations.
- Developing – The student shows partial achievement but is not yet consistently meeting expectations.
- Needs Additional Support – The student requires targeted teaching and support to meet expected skills.
These categories help teachers and parents better understand whether a student is on track, ahead, or in need of support.
Although there are no official benchmarks, most schools are aiming to have at least 66% of their students as “Strong” or “Exceeding”.
What domains are being assessed?
There are five domains that are assessed:
- Reading: Assesses a student's ability to comprehend, interpret, and analyse a range of written texts, including narratives, information texts, and persuasive writing. Students are required to read passages and answer multiple-choice or short-answer questions based on the content.
- Writing: Evaluates how well students can express ideas through written language. Students are given a prompt (either persuasive or narrative) and assessed on their ability to structure their ideas, use appropriate vocabulary, organise paragraphs, and apply correct grammar and punctuation.
- Spelling: Measures students’ understanding of common spelling patterns and their ability to apply them correctly in written words. This helps identify their grasp of phonics, word structure, and spelling rules.
- Grammar and Punctuation: Assesses students’ knowledge and correct use of sentence structure, verb agreement, capitalisation, commas, apostrophes, and other grammatical conventions necessary for clear written communication.
- Numeracy: Tests students’ ability to solve problems using mathematical knowledge across number, algebra, measurement, geometry, and statistics. It includes both multiple-choice and short-answer questions, requiring reasoning and calculation.
What were the results in 2025?
Reading
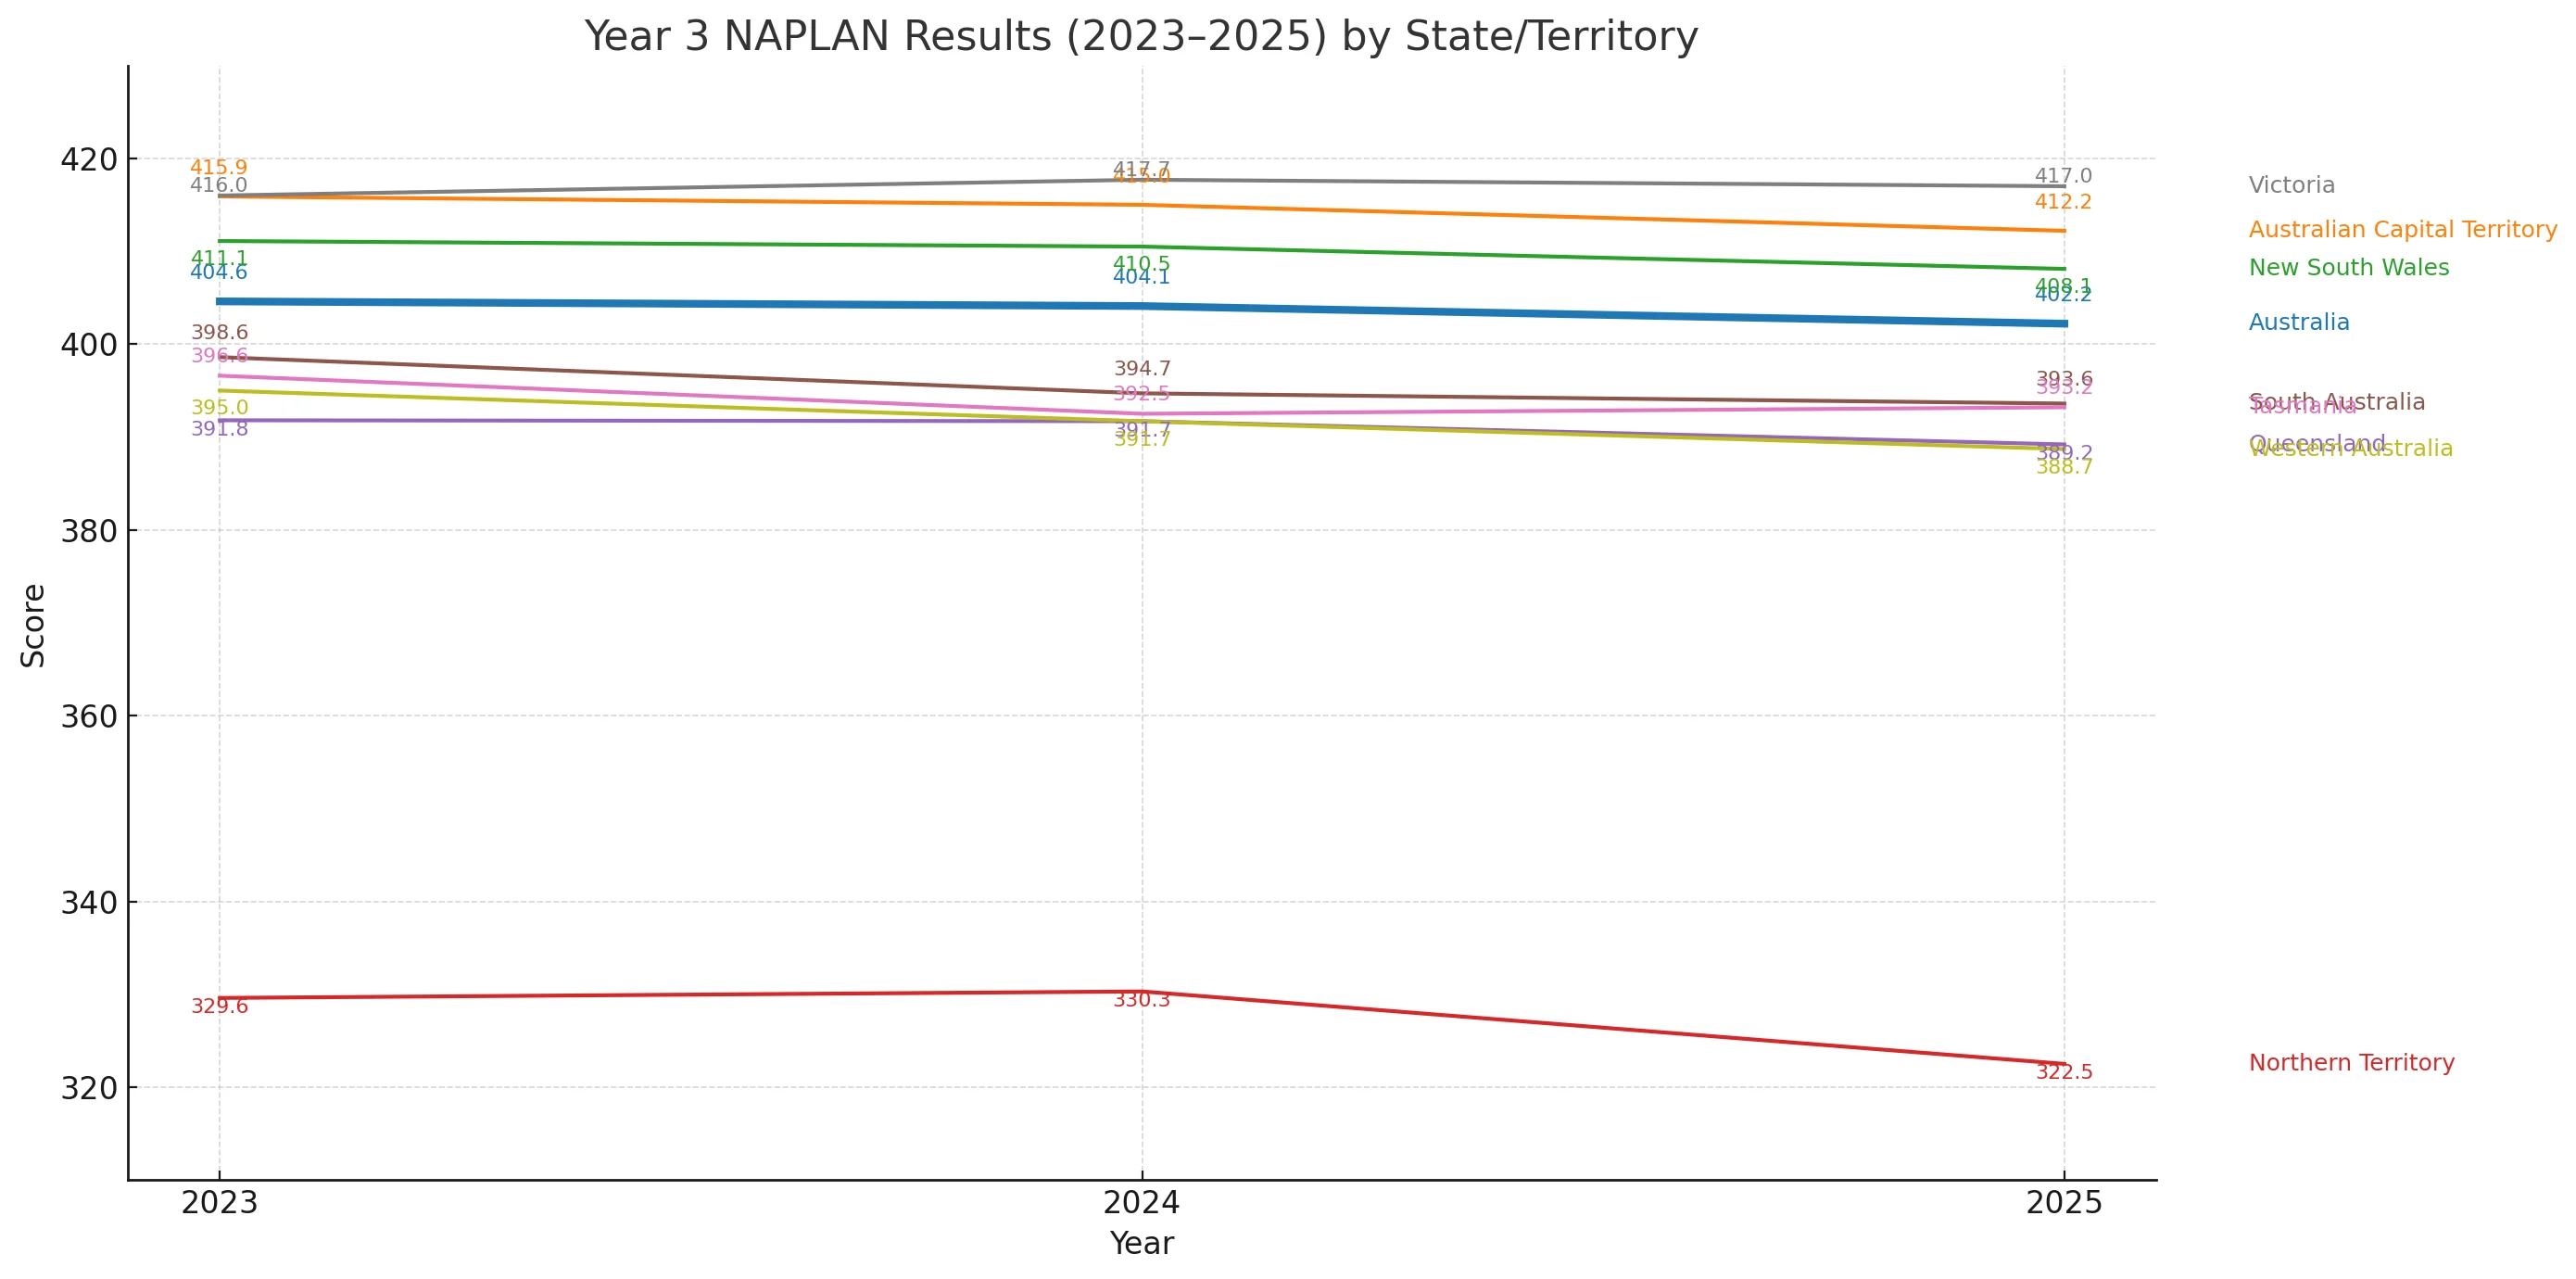
In reviewing the data, Victoria stands out as the top performer across all three years, reaching a peak of 417.7 in 2024, while the Northern Territory consistently records the lowest scores, with a significant drop from 330.3 in 2024 to 322.5 in 2025. This represents the most notable year-on-year decline among all states and territories.
At the national level, Australia's average score has declined modestly from 404.6 in 2023 to 402.2 in 2025, reflecting a subtle downward trend. Western Australia and South Australia also show gradual declines over the period. In contrast, Tasmania has remained relatively stable, with a slight improvement in 2025 after a dip the previous year.
Overall, the data suggests a general plateau or slight decline in performance for most regions, with Victoria continuing to lead the nation in Year 3 literacy and numeracy outcomes.
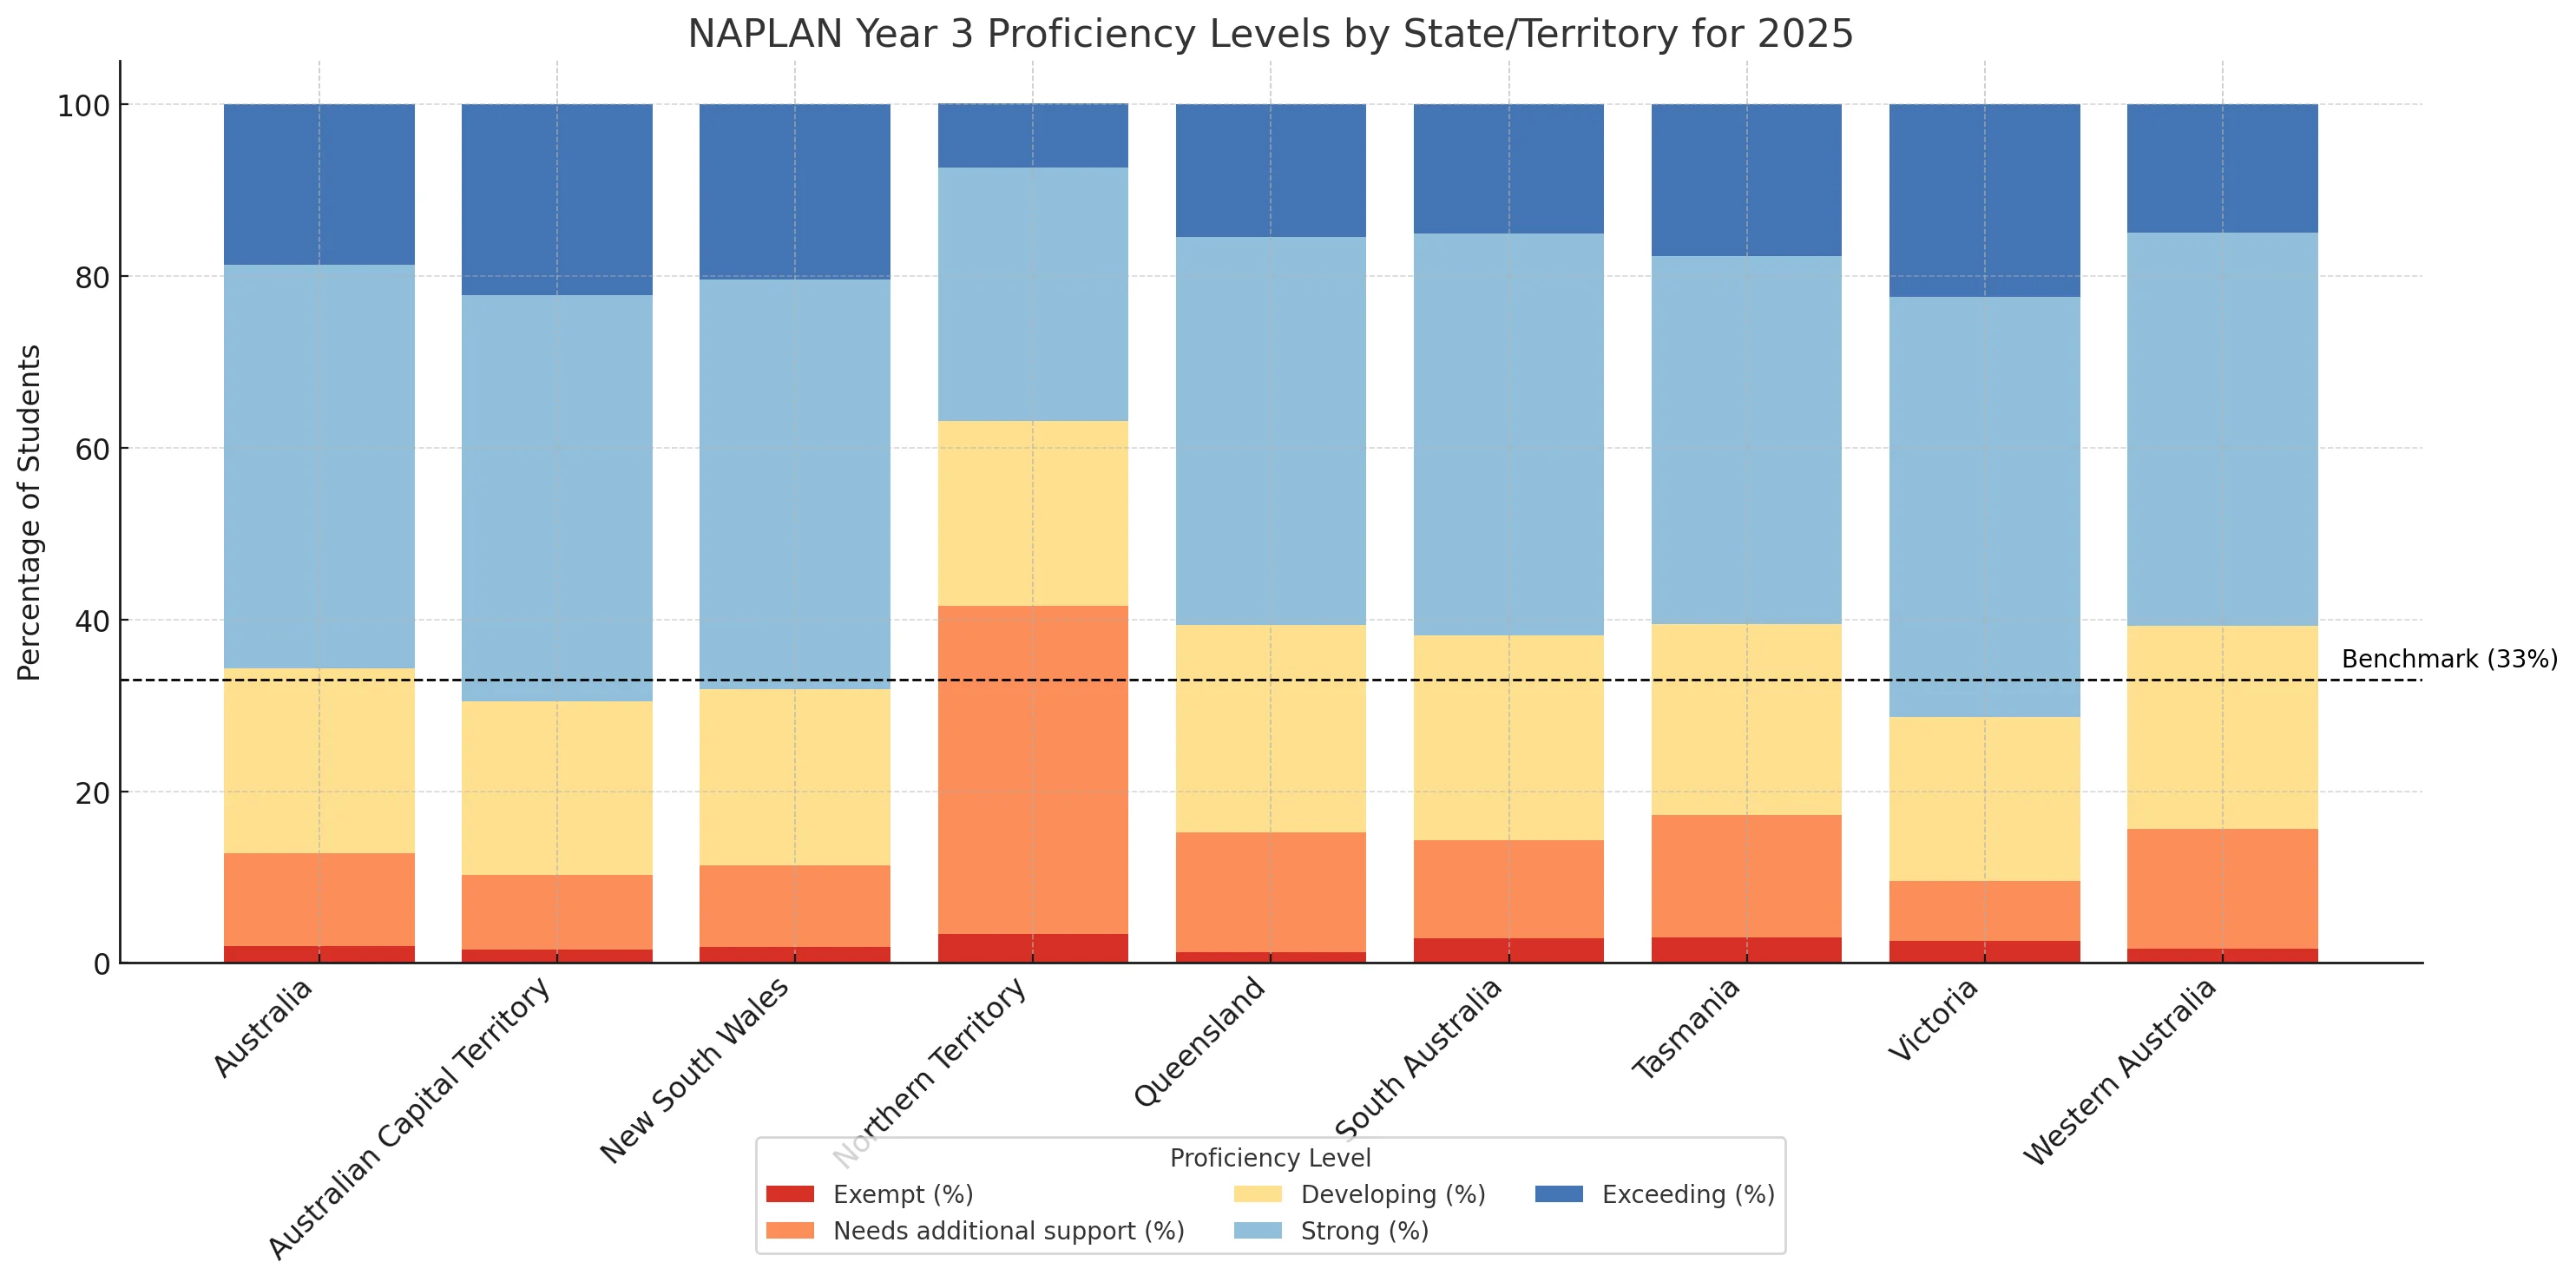
Below displays the distribution of proficiencies for students in 2025. Students who are “Exceeding” or “Strong” are considered at the expected level.
Writing
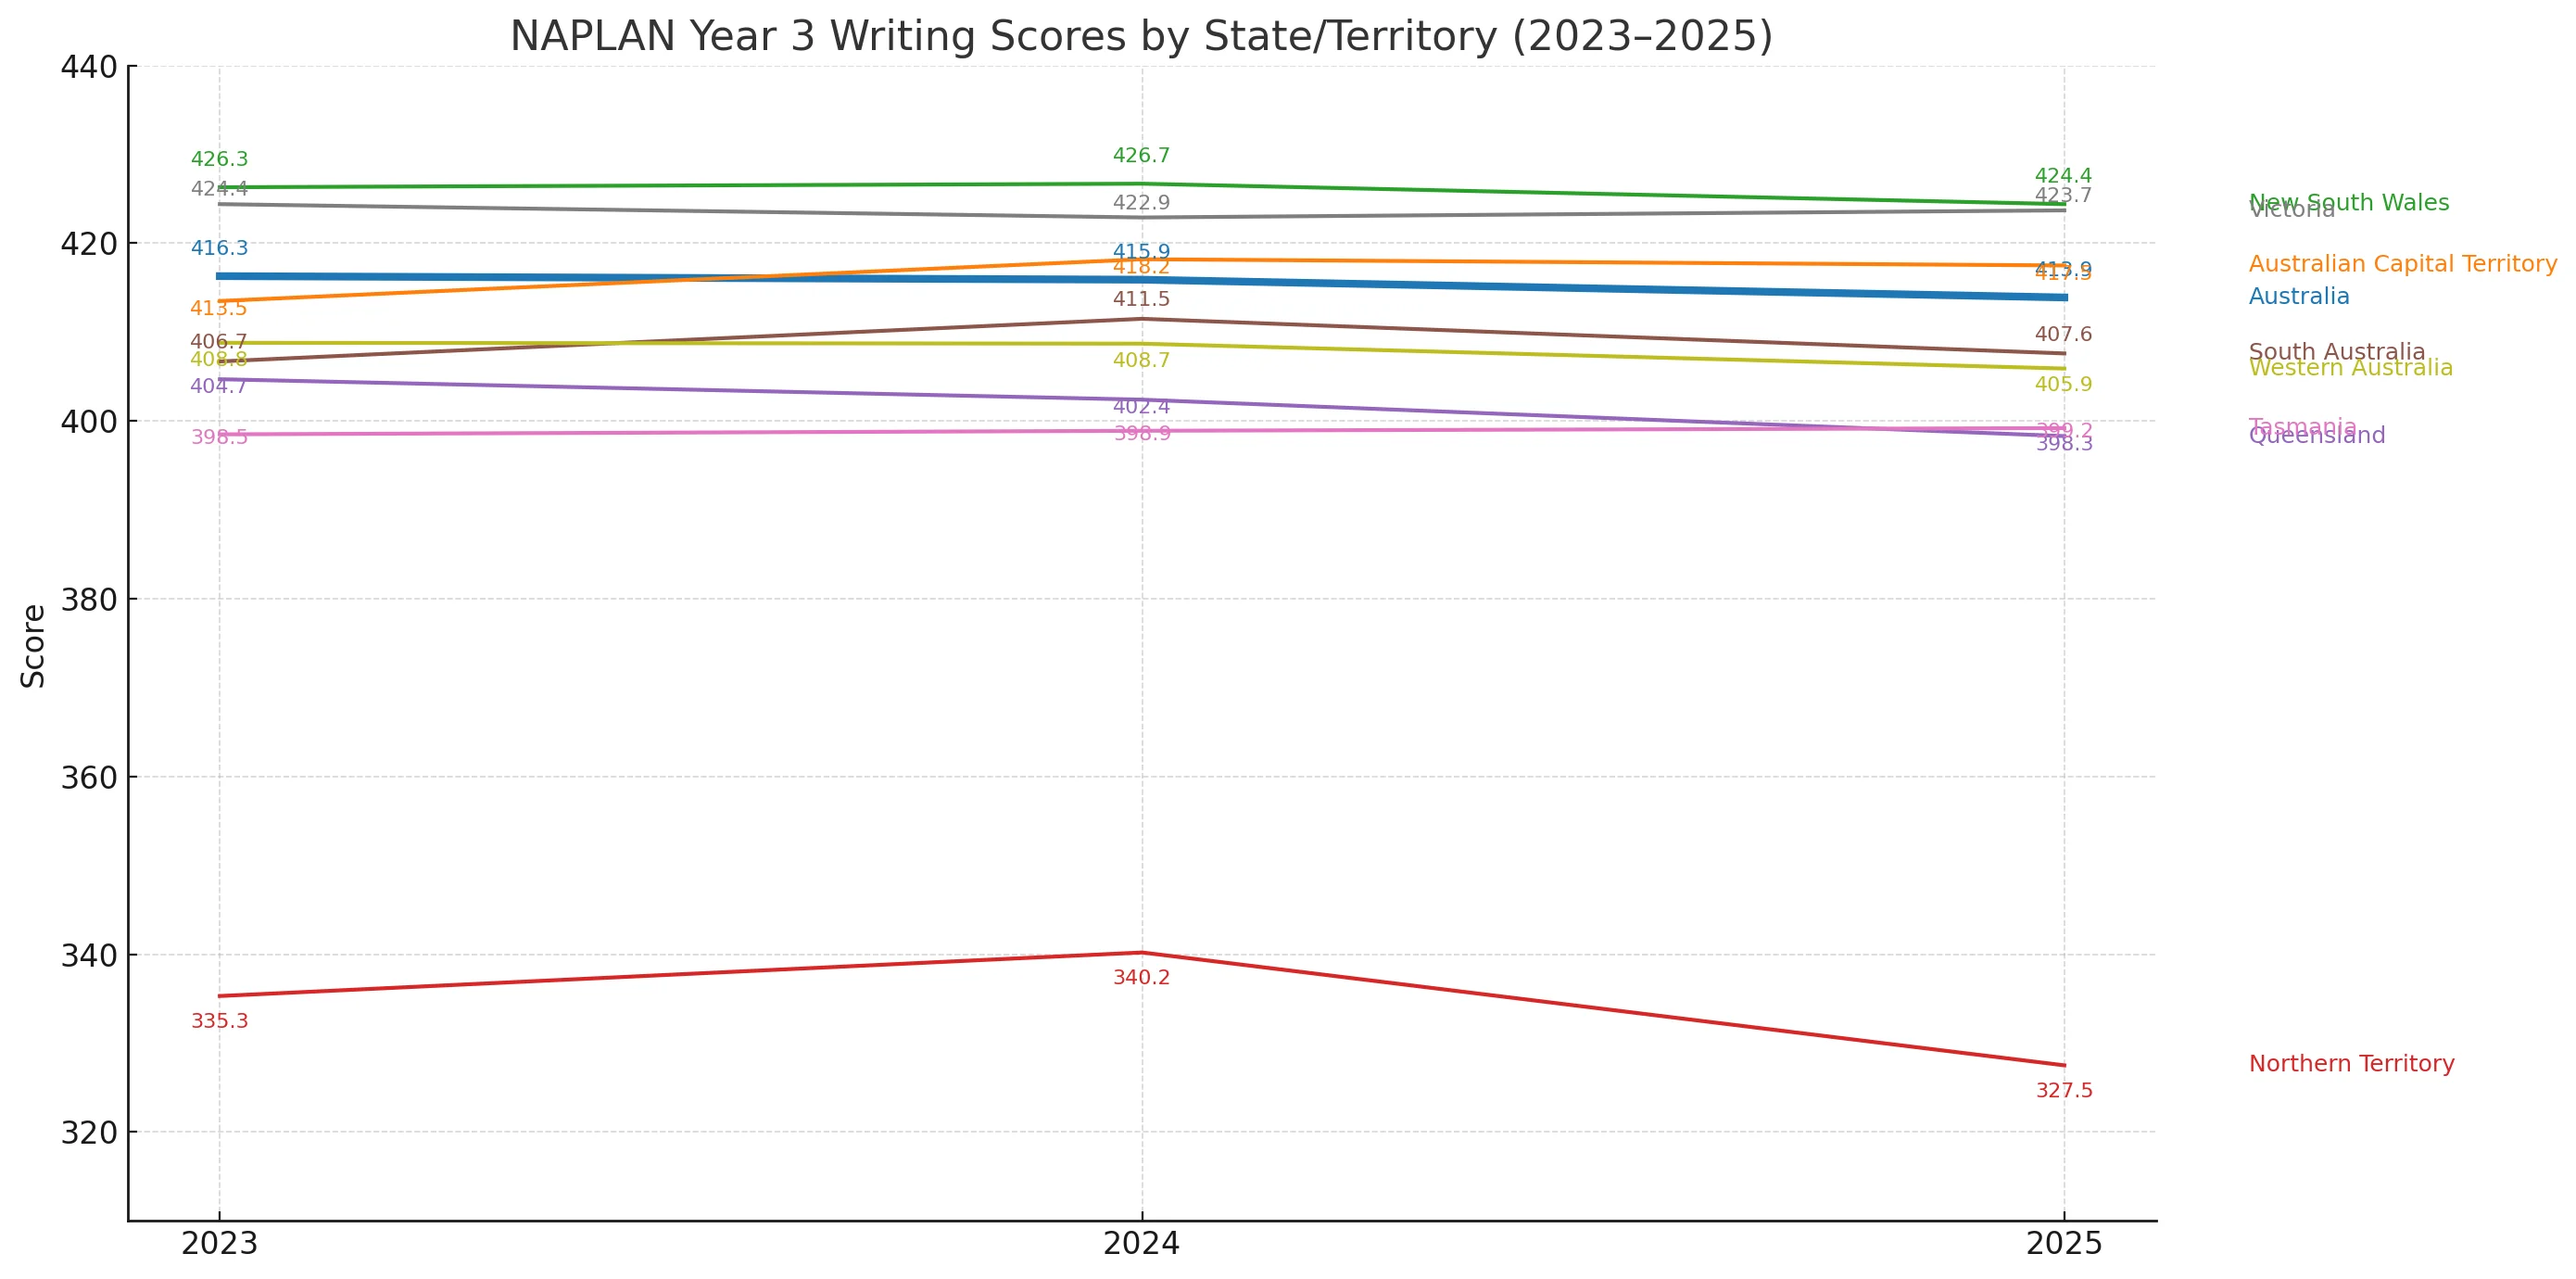
New South Wales and Victoria continue to lead with consistently high Writing scores, both hovering around the mid-420s. Meanwhile, the Northern Territory has seen a sharp decline in 2025, dropping from 340.2 to 327.5, widening the gap with other regions. The national average has also declined slightly over the three years, falling from 416.3 to 413.9. Tasmania remains relatively flat and stable, while the ACT continues to perform strongly, just below NSW and VIC.
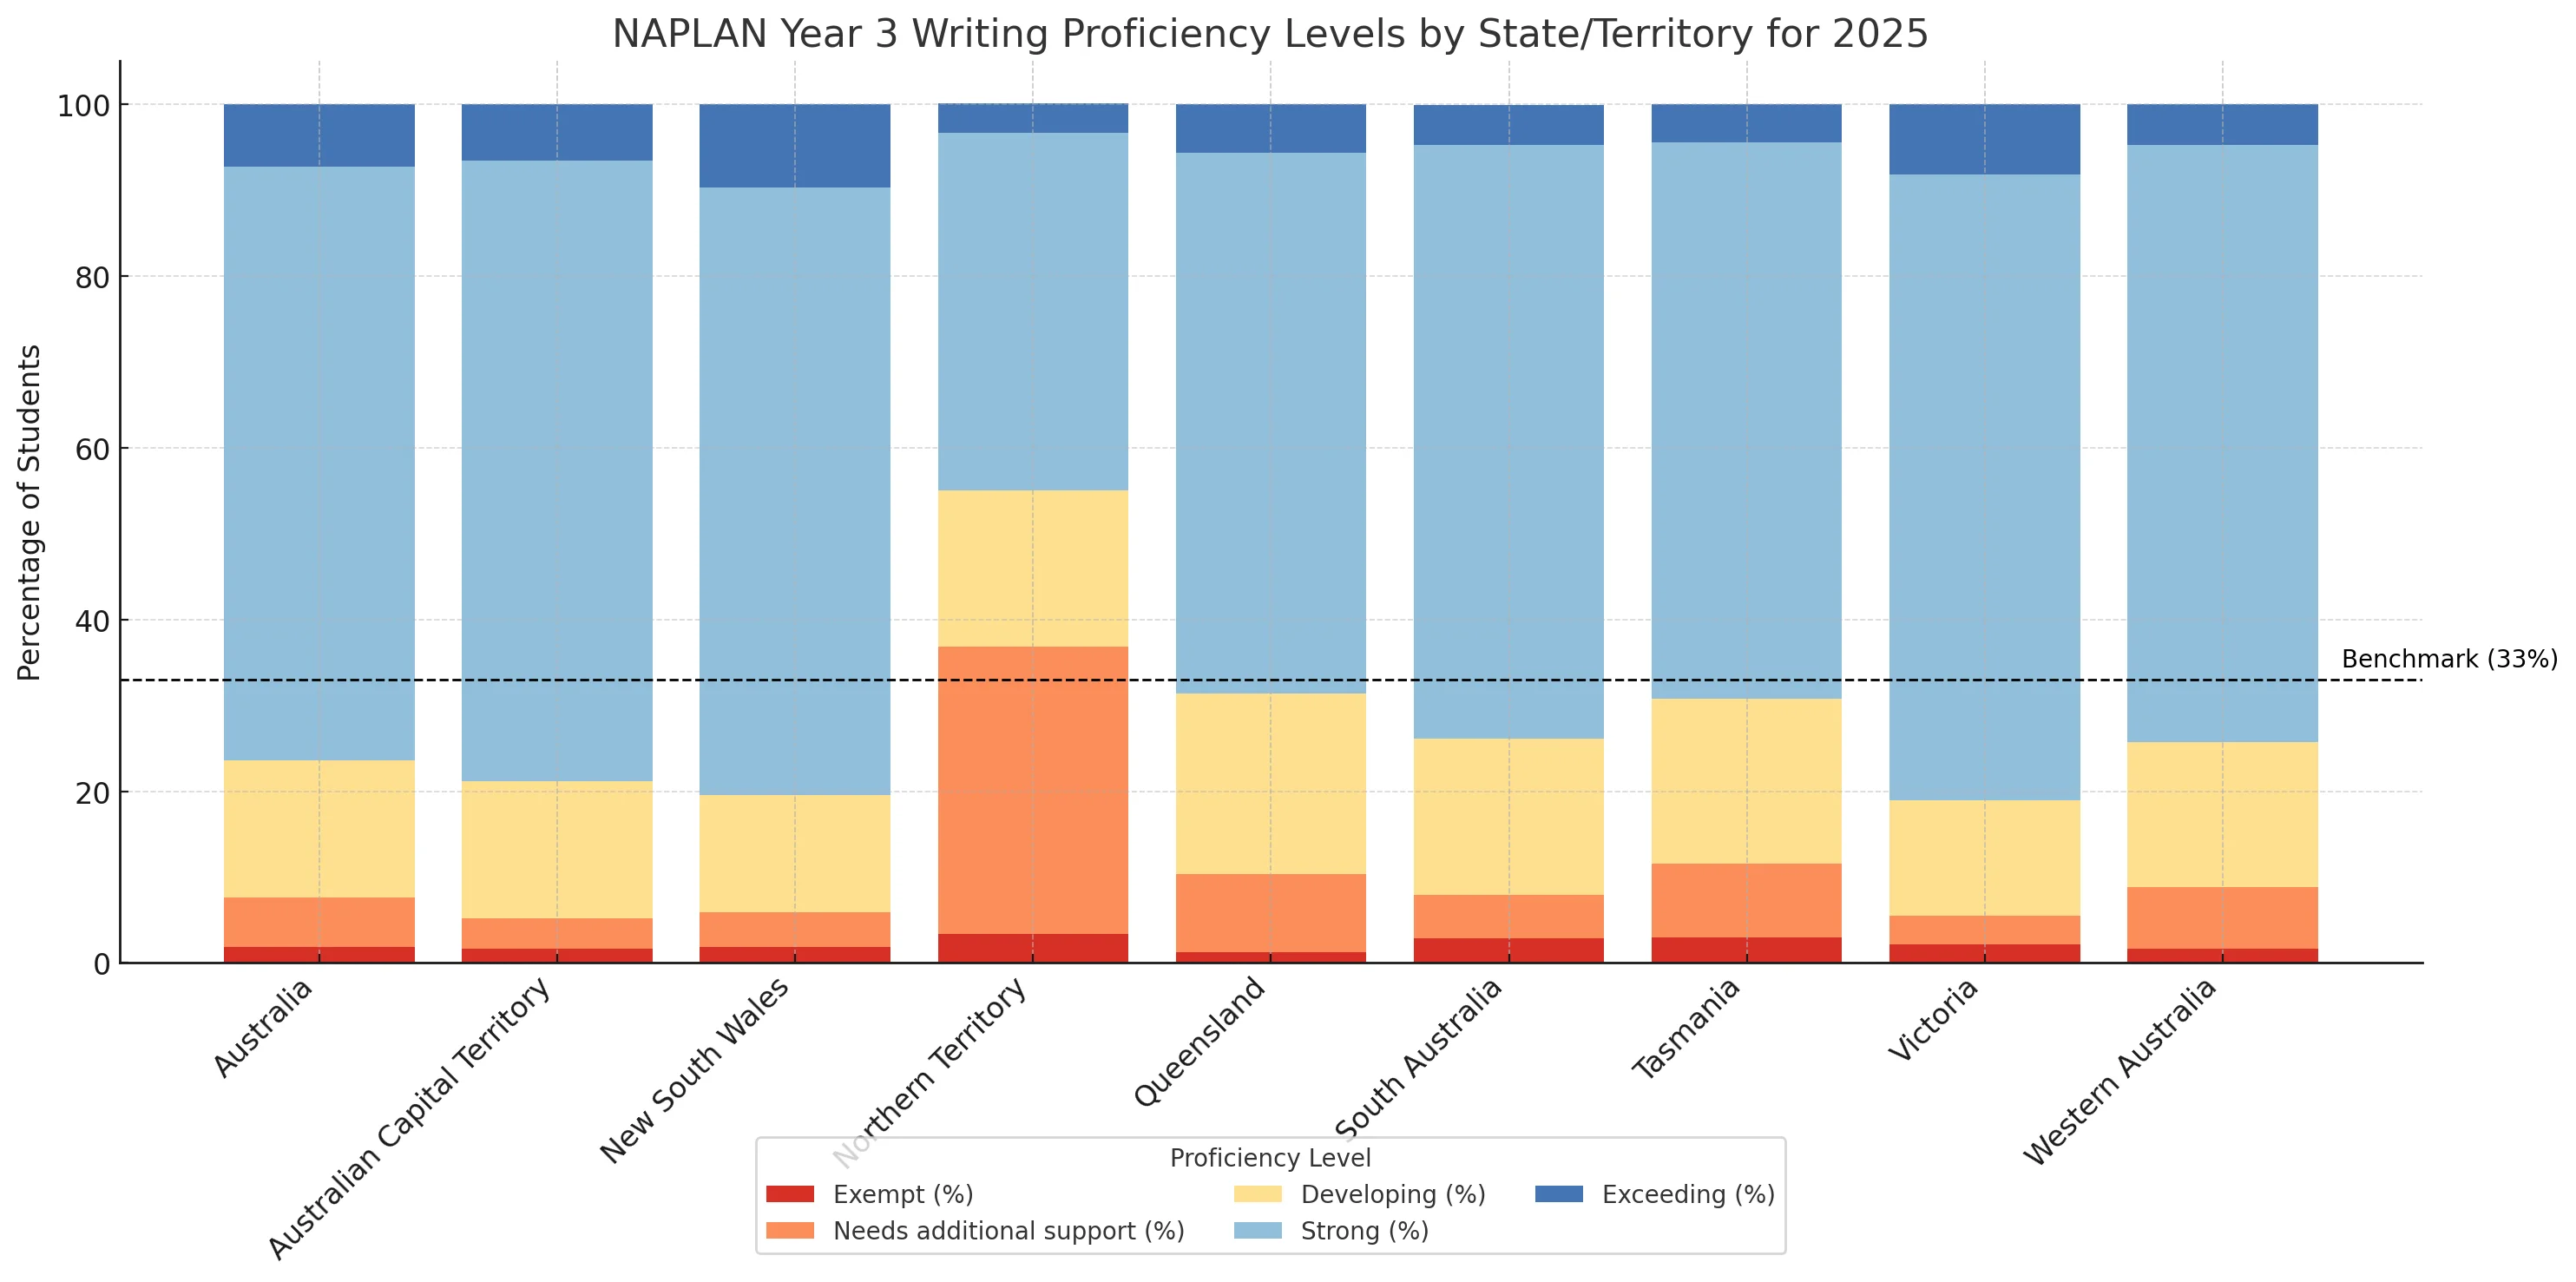
Below displays the distribution of proficiencies for students in 2025. Students who are “Exceeding” or “Strong” are considered at the expected level.
Spelling
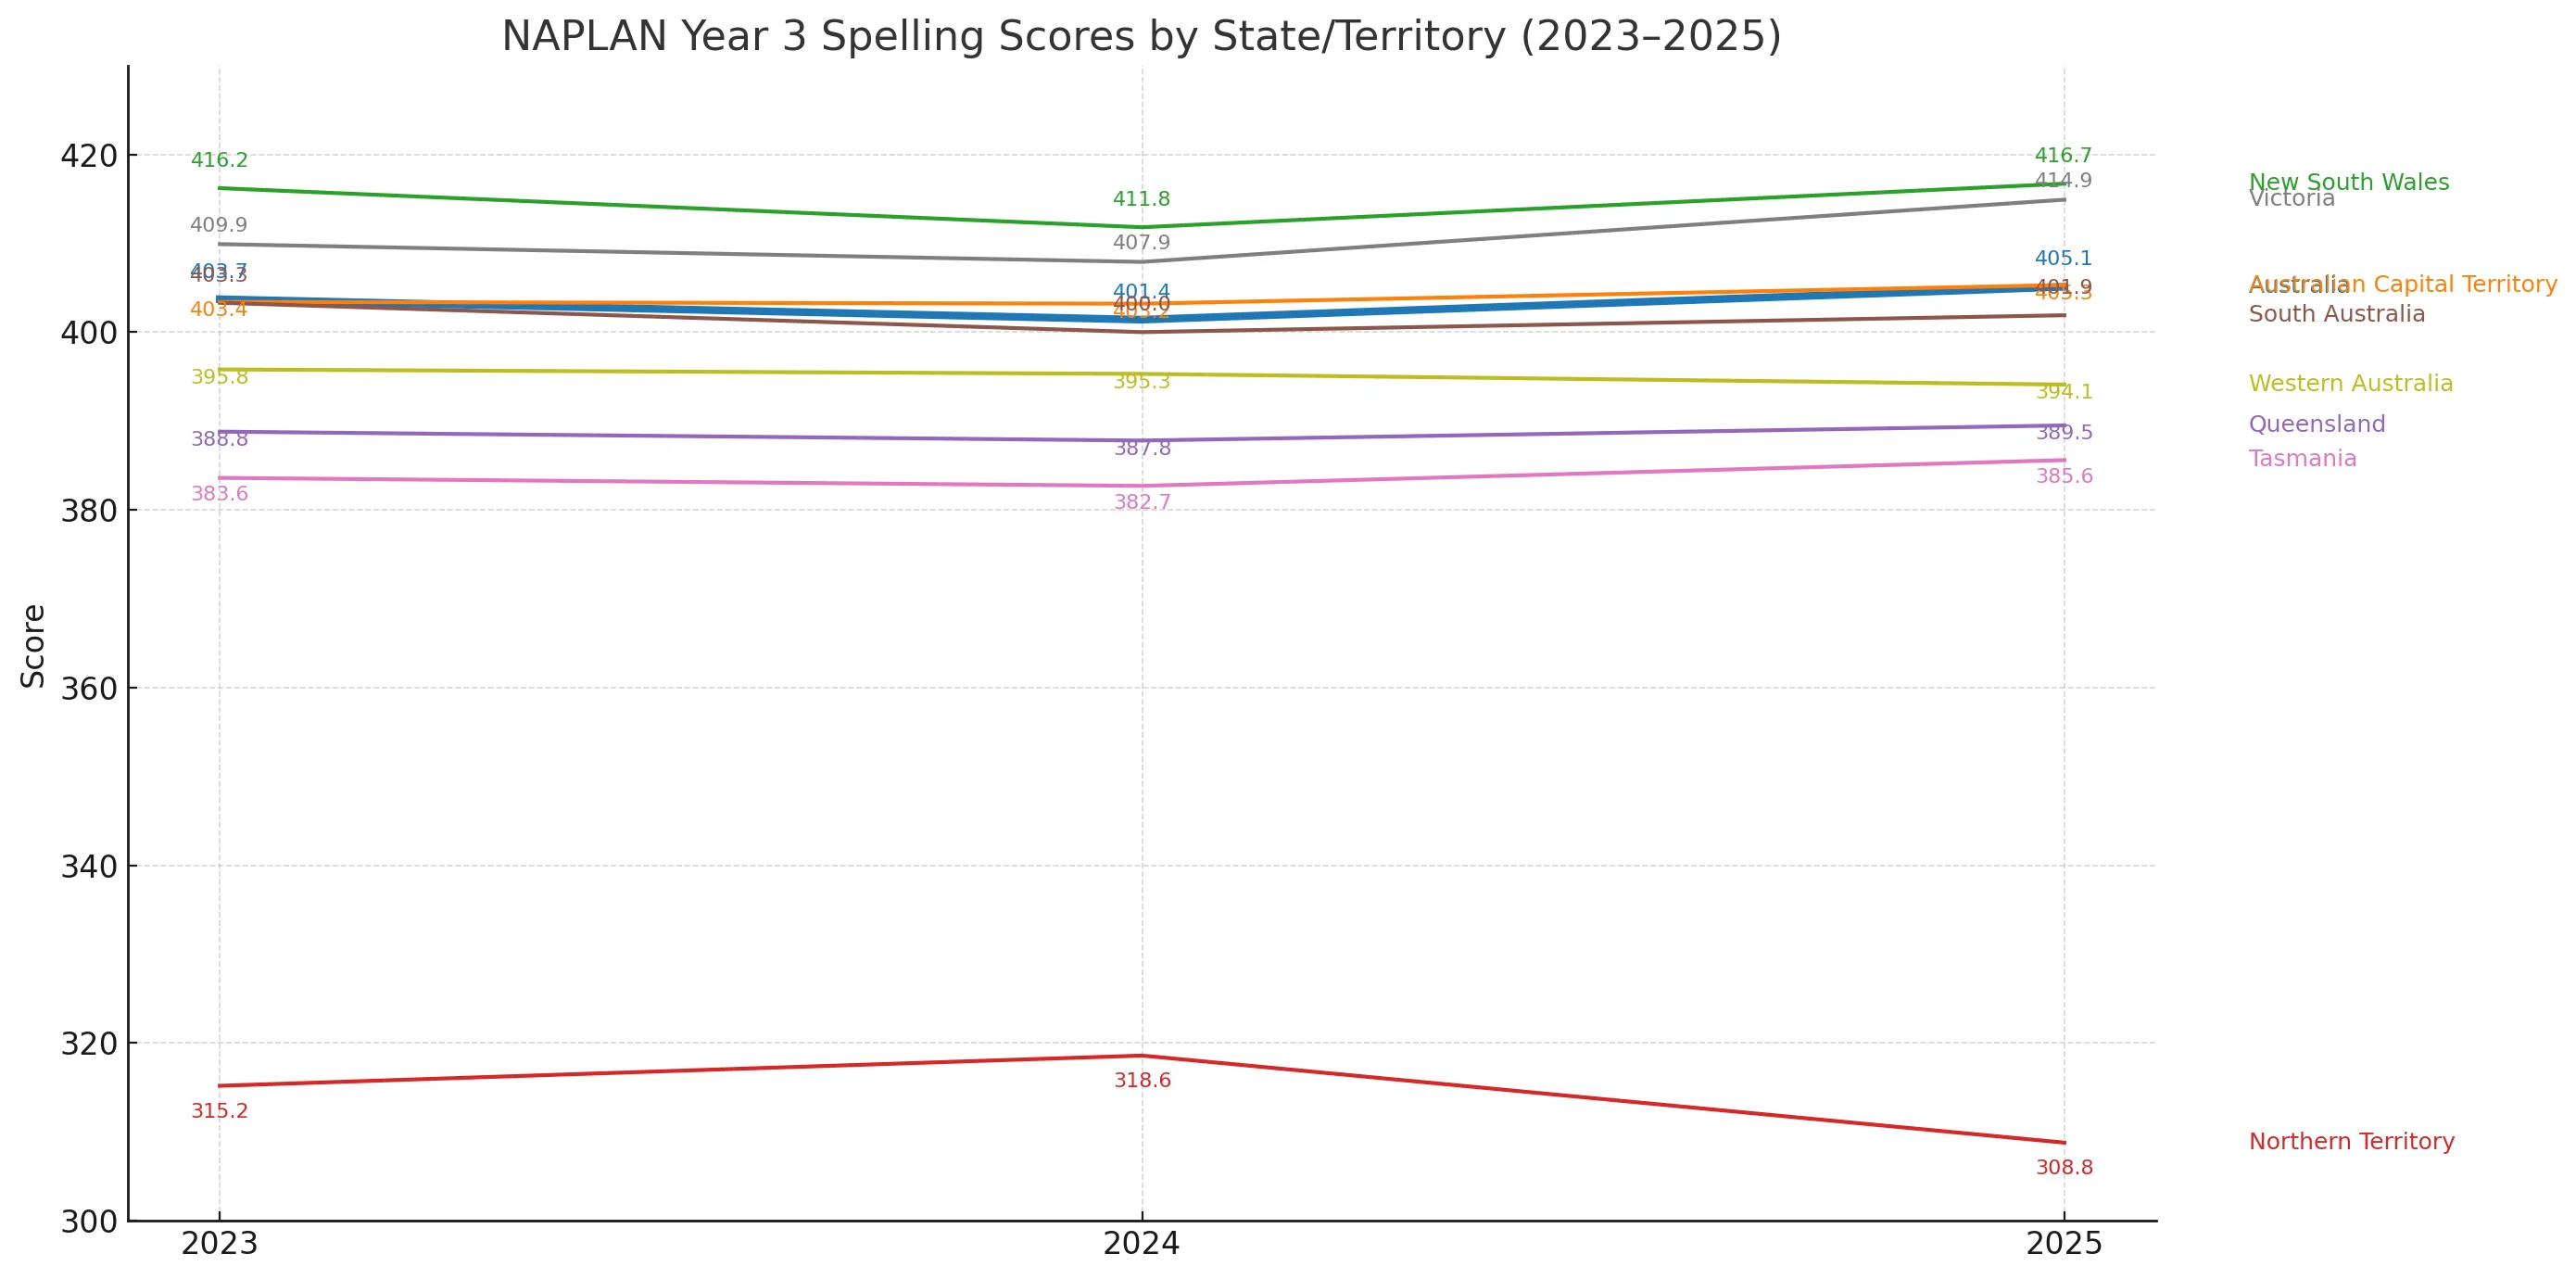
New South Wales and Victoria continue to perform strongly, with NSW reaching 416.7 in 2025, the highest spelling score nationally. Victoria also shows a strong upward trend, climbing from 407.9 to 414.9 between 2024 and 2025. In contrast, the Northern Territory has seen a concerning drop to 308.8, further widening the gap between it and the rest of the country. The national average rebounded slightly in 2025 after a dip in 2024, suggesting modest improvement overall. Most other states, including Queensland and WA, have remained relatively stable without significant gains or losses.
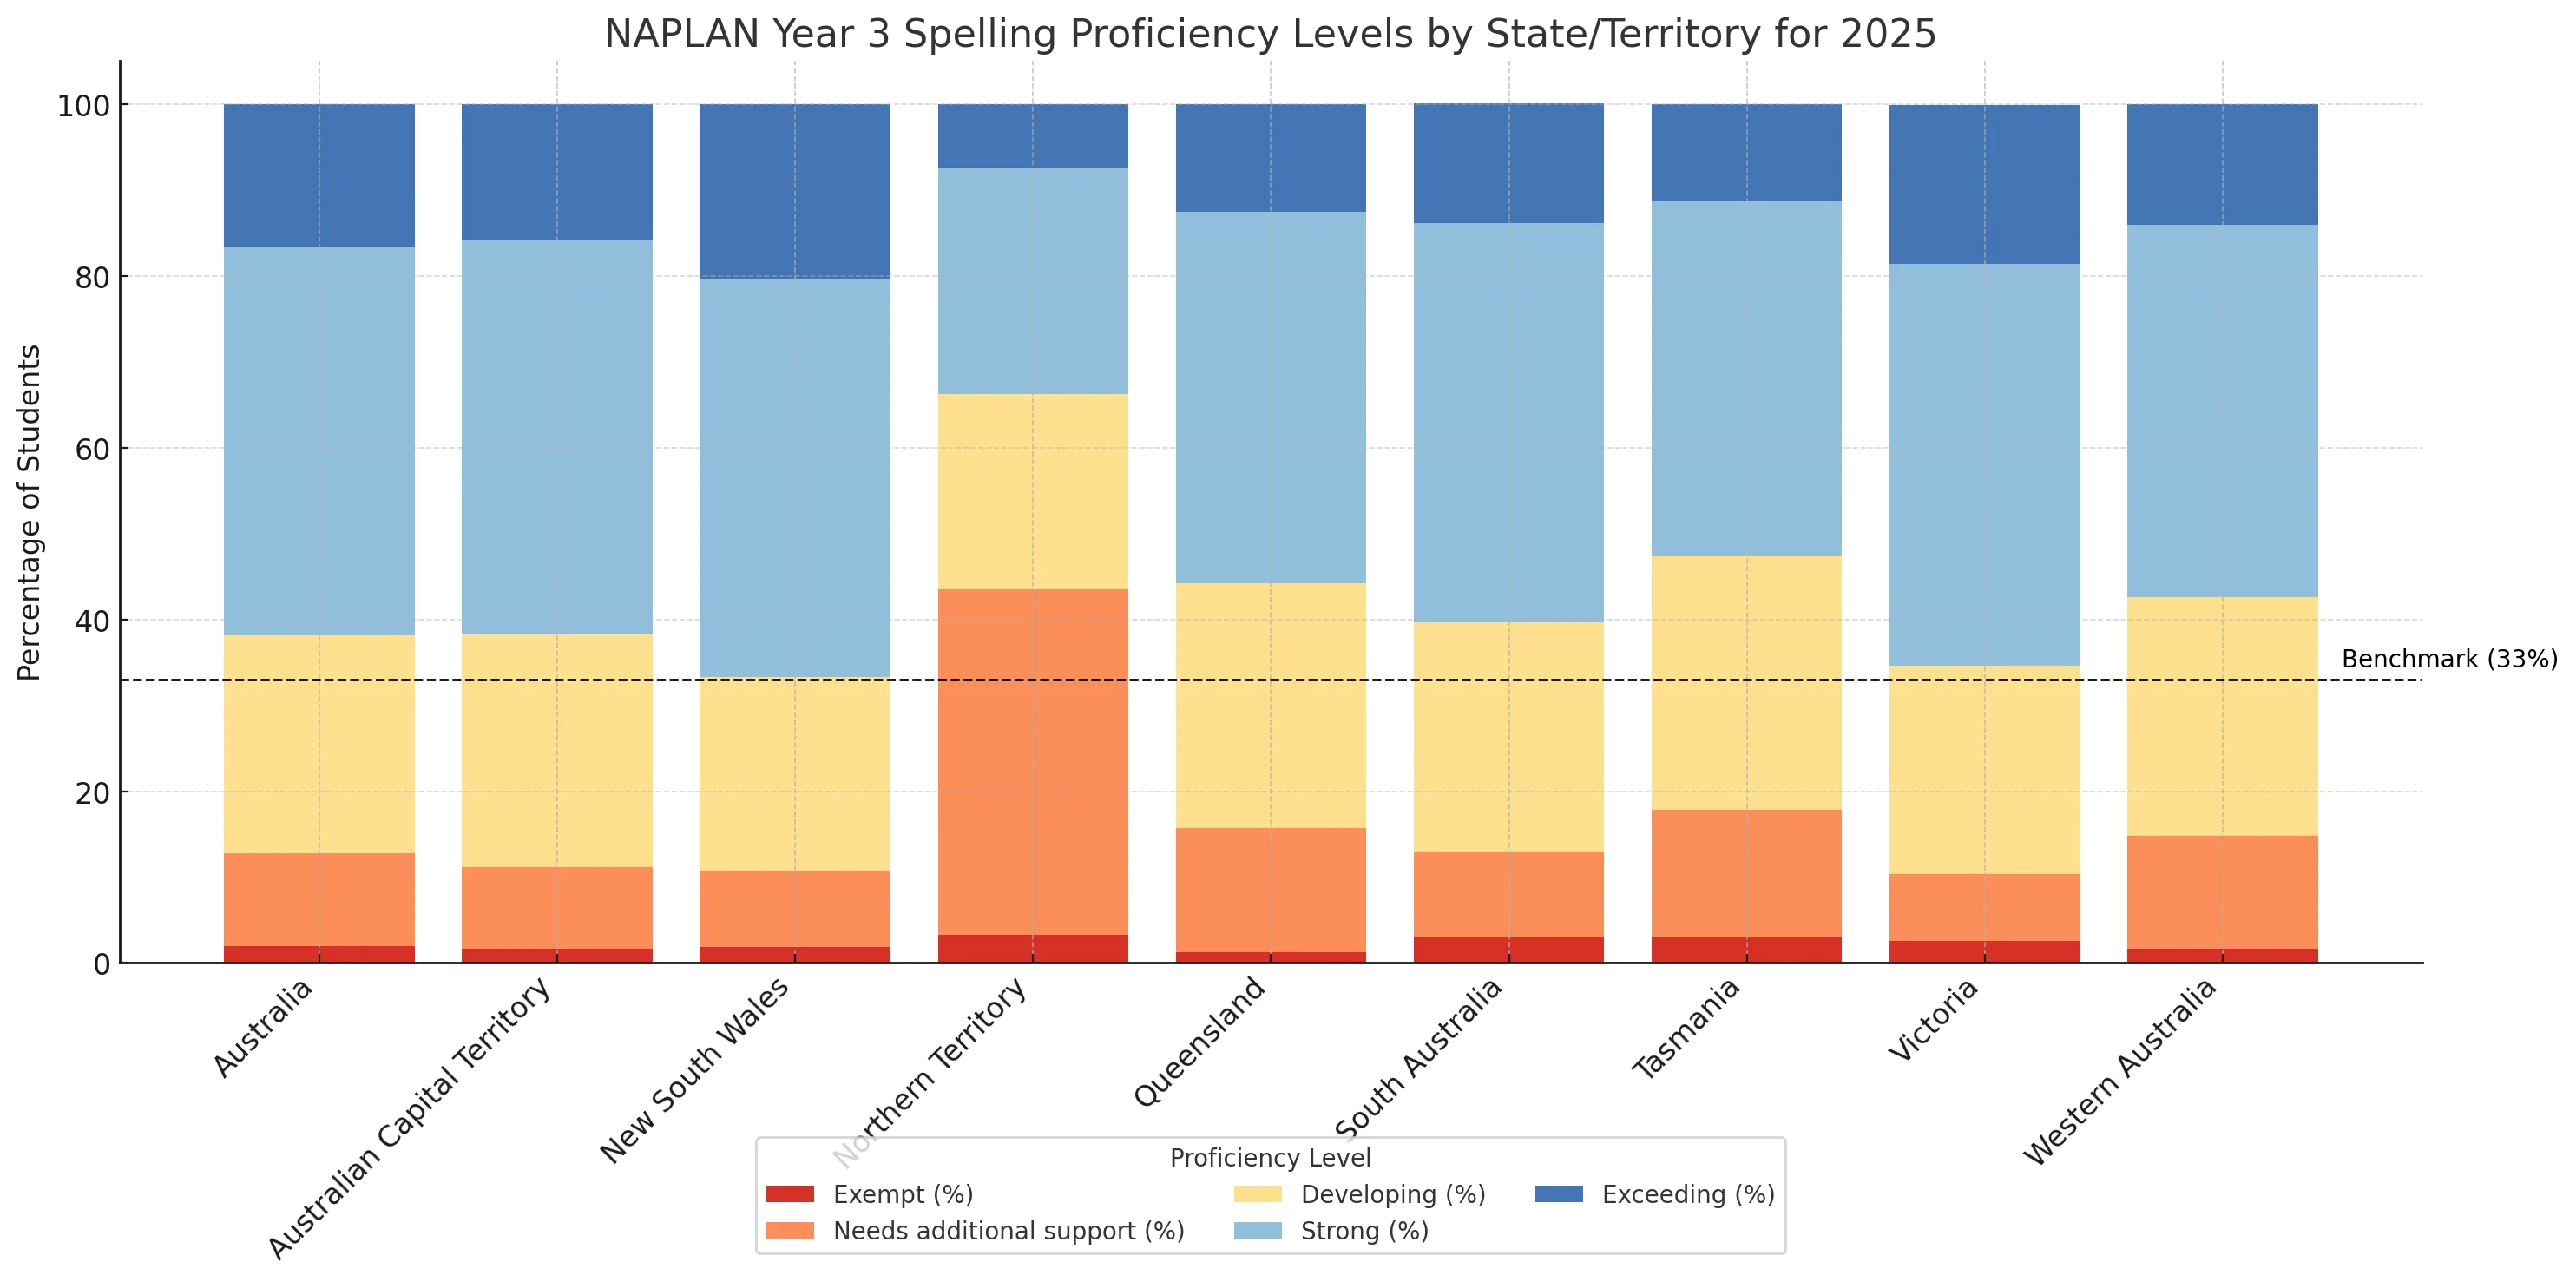
The national profile reveals that over 60% of students are achieving in the “Strong” or “Exceeding” categories, but there is considerable variation across jurisdictions. New South Wales and Victoria have the highest proportions of students in the top bands, with NSW notably having 20.3% in “Exceeding”. In contrast, the Northern Territory shows a significantly different distribution, with 40.2% needing additional support, far surpassing the benchmark of 33% and highlighting a stark gap in outcomes. States like Queensland and Tasmania also have elevated proportions of students in the “Developing” band, suggesting room for targeted intervention.
Grammar and punctuation
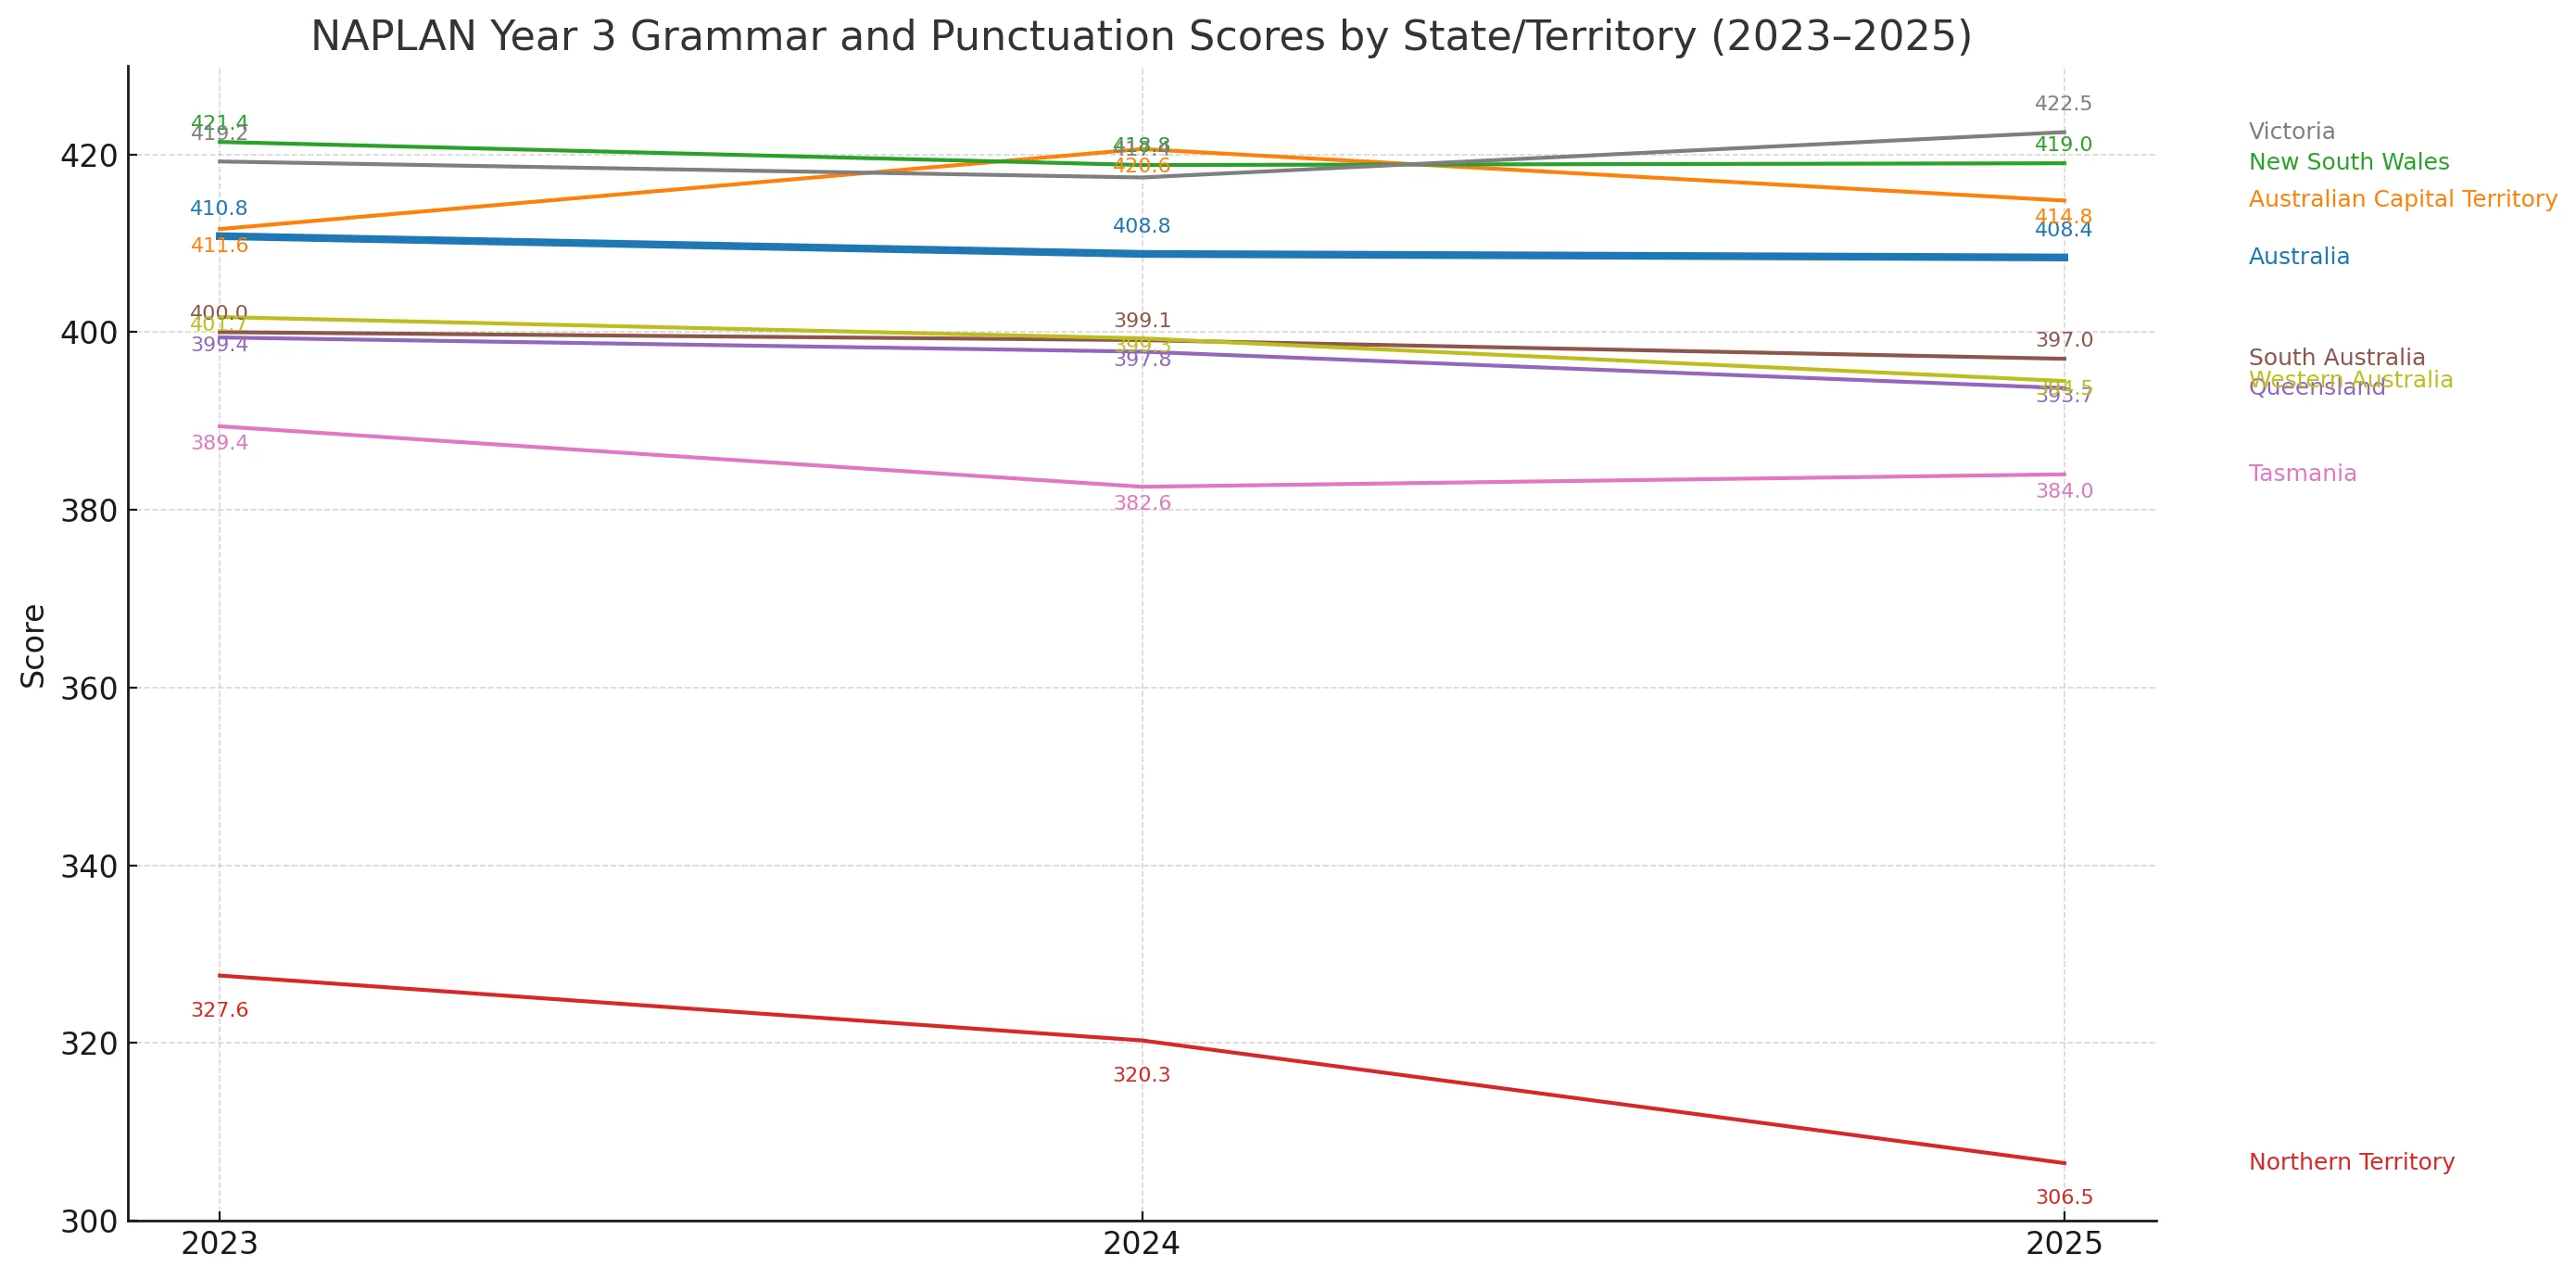
Victoria achieved the highest result in 2025 with a score of 422.5, showing a consistent upward trend across the three years. New South Wales maintained strong performance, consistently above 418. Meanwhile, the Northern Territory recorded a sharp and concerning decline, dropping from 327.6 in 2023 to just 306.5 in 2025, the lowest of any jurisdiction across all domains. The national average has remained mostly stable, hovering around 408, while most other states like Queensland, South Australia, and Western Australia experienced slow declines. This domain shows the widest spread of performance, indicating significant differences in grammatical proficiency across the country.
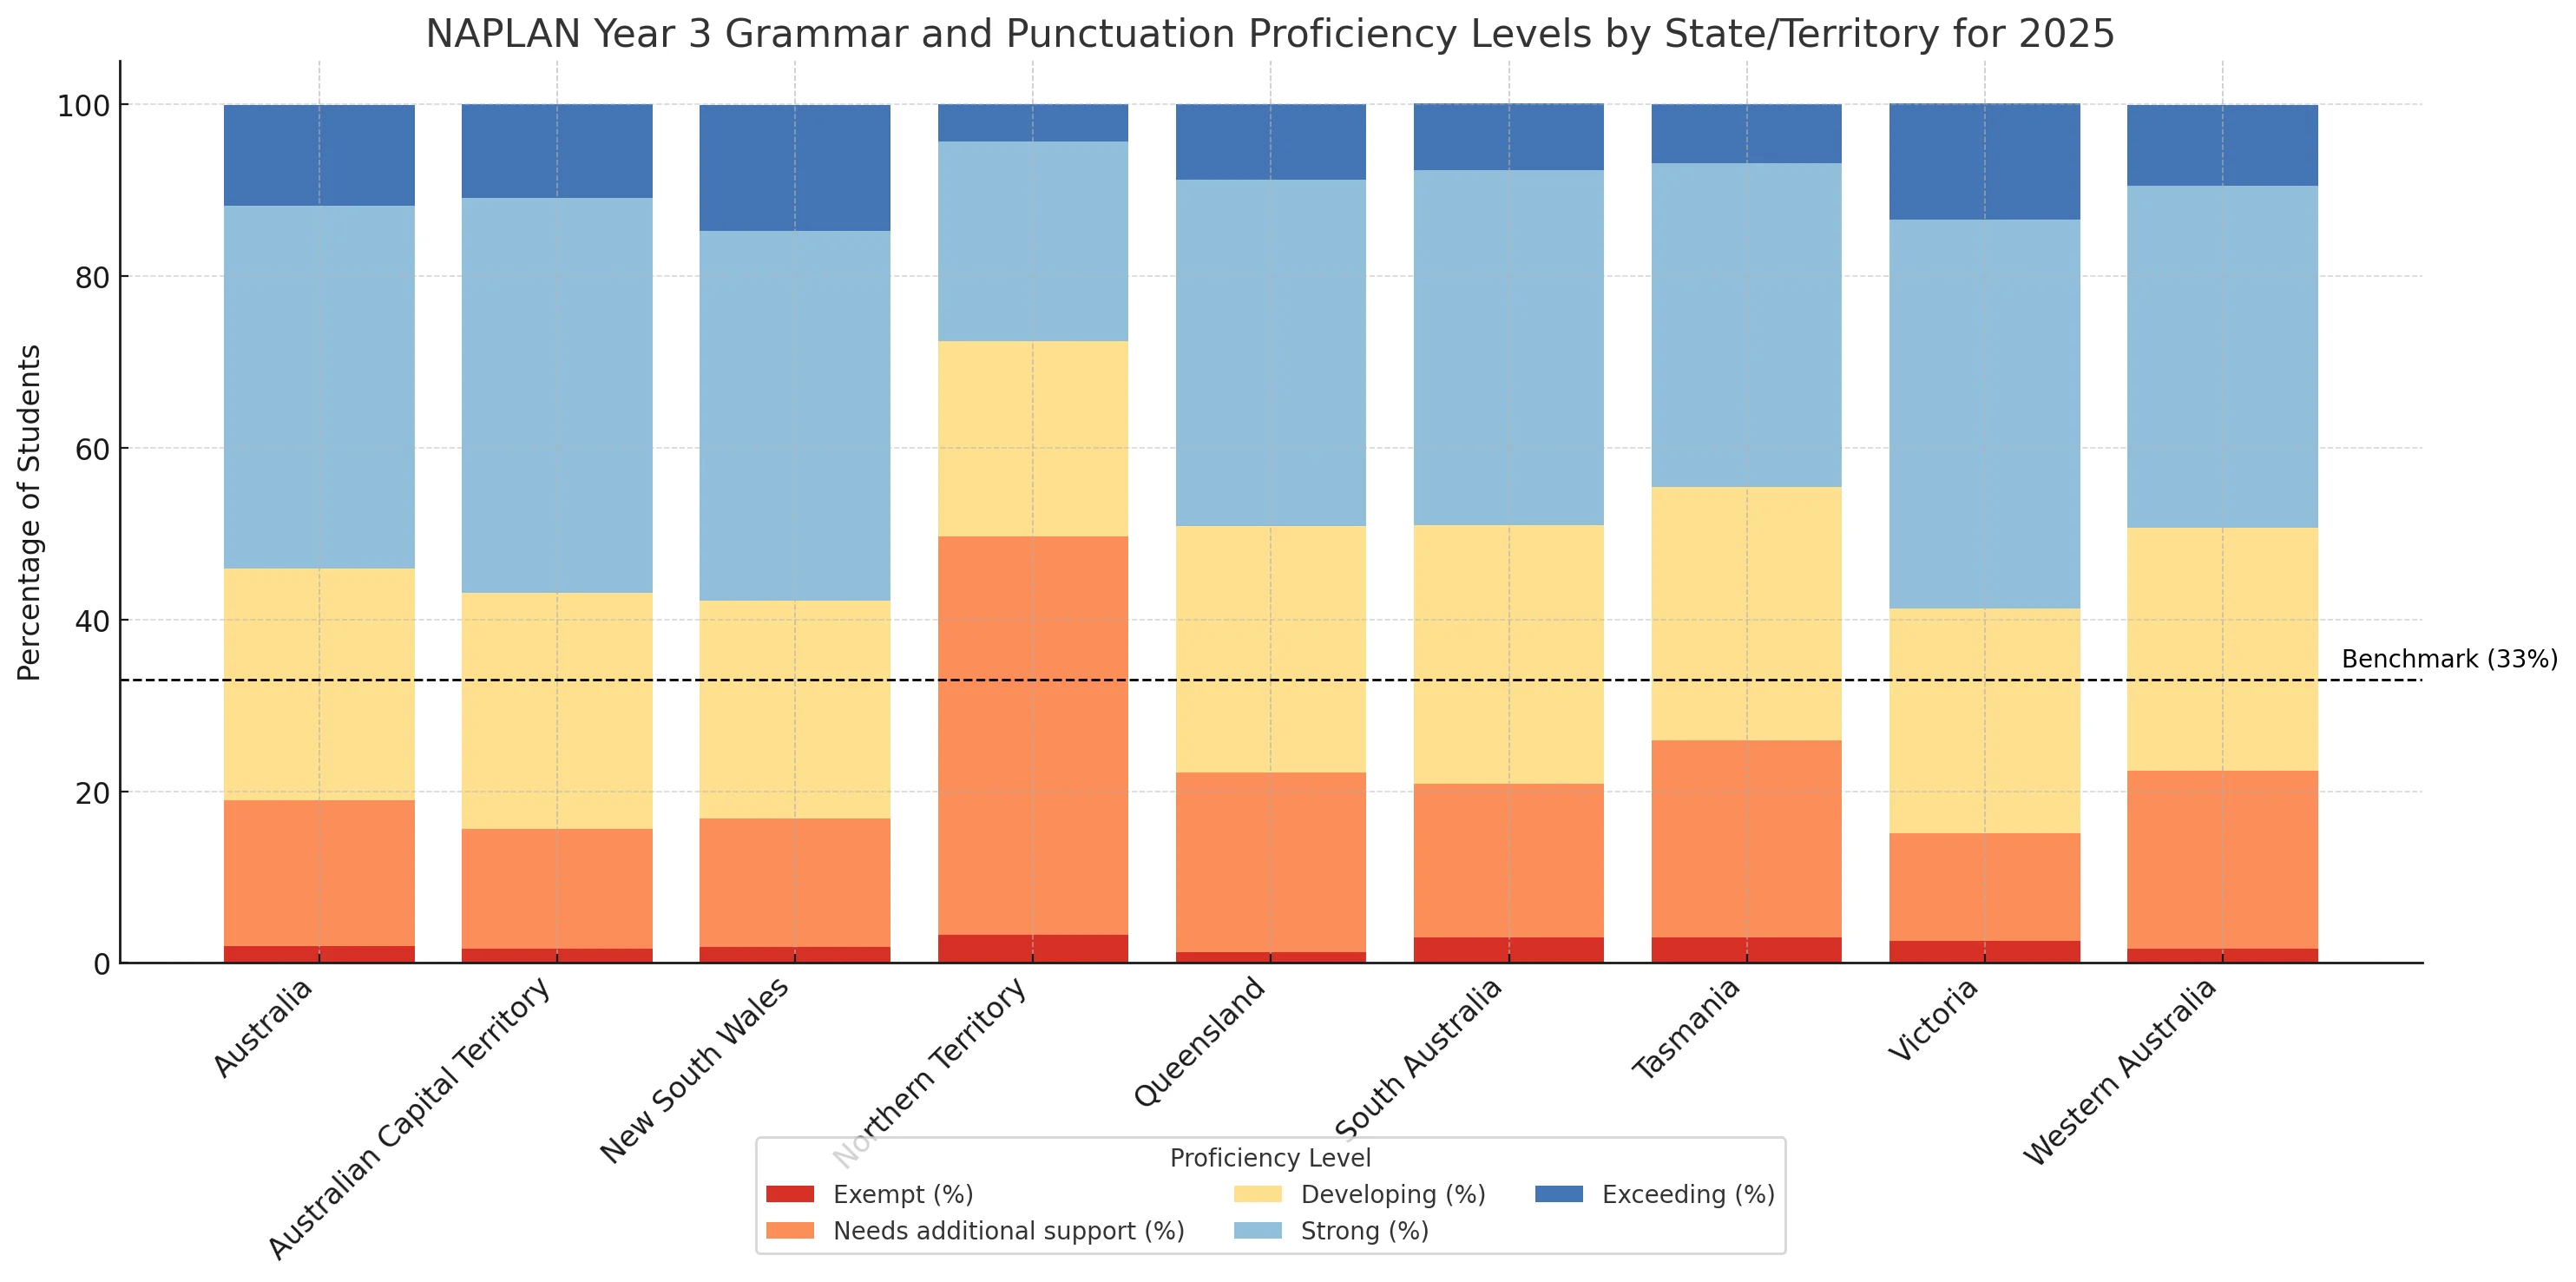
The national average shows that just over 54% of students are achieving at the Strong or Exceeding levels, but performance is far from uniform across the country. Victoria and the ACT stand out with high proportions in these top bands, while New South Wales leads in the Exceeding category at 14.6%. In stark contrast, the Northern Territory shows major challenges, with nearly half (46.4%) of students needing additional support and only 4.3% exceeding expectations. Other states such as Tasmania and Queensland also have a higher concentration of students in the lower bands, suggesting a need for targeted support to lift overall grammar and punctuation skills.
Numeracy
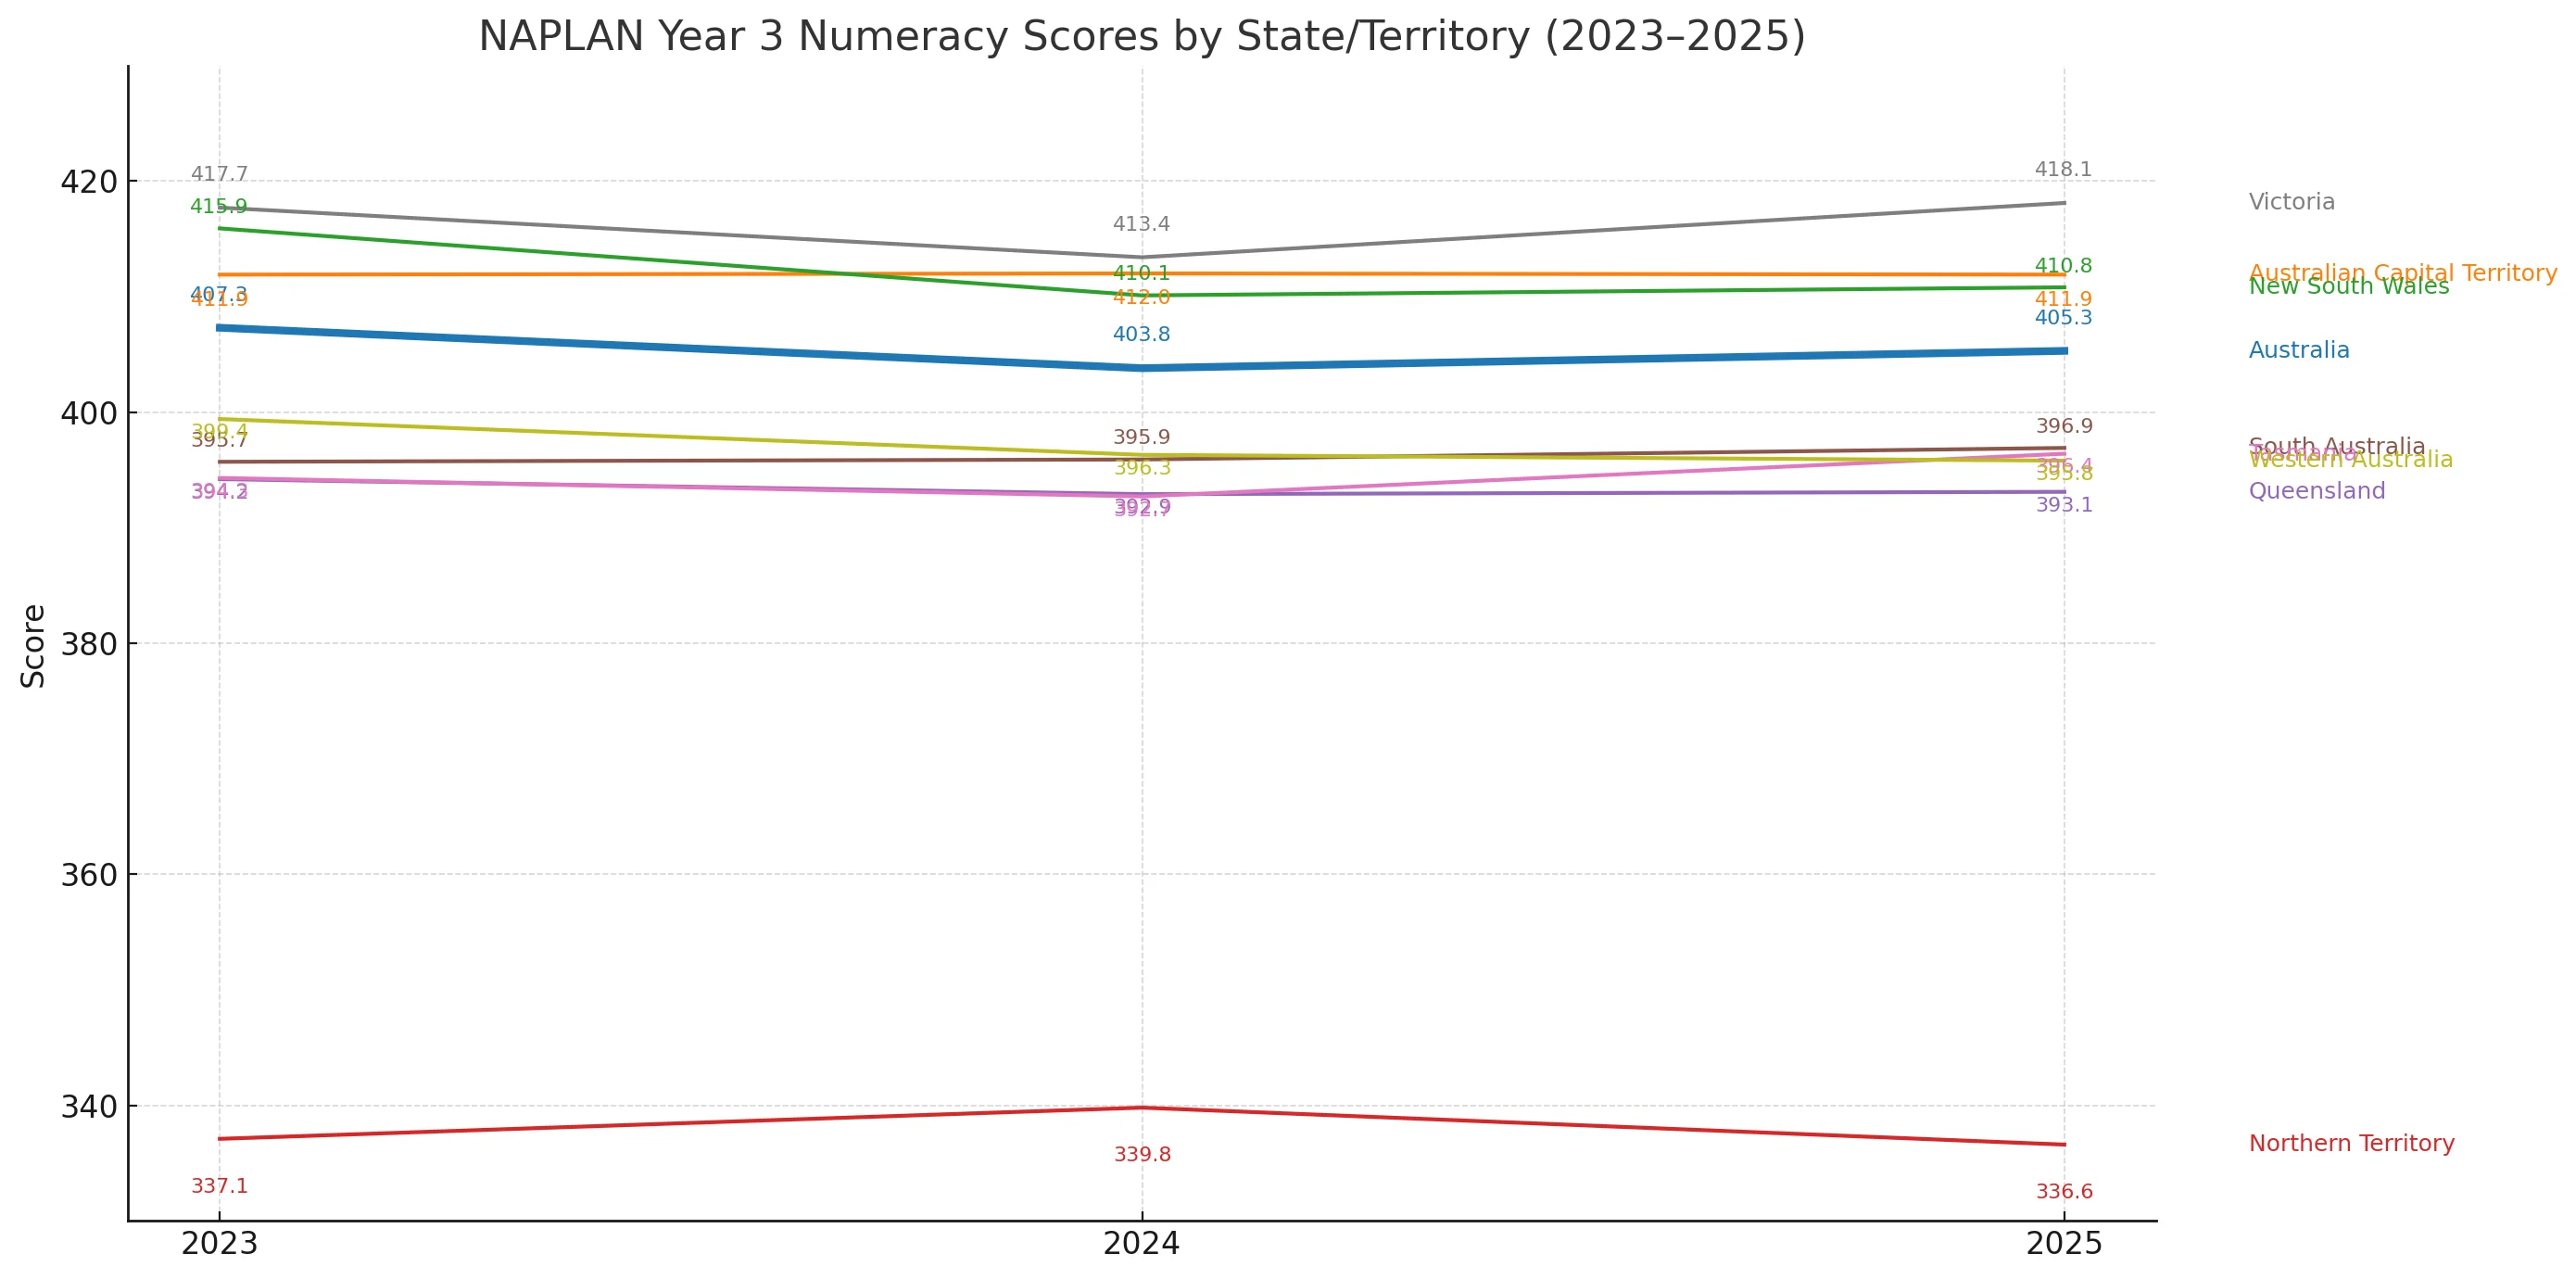
Victoria emerges as the top performer, reaching a high of 418.1 in 2025, a notable rebound after a dip in 2024. New South Wales and the ACT also maintain strong performance, though relatively flat across the years. In contrast, the Northern Territory continues to lag well behind, with scores dropping slightly to 336.6, highlighting a persistent and significant performance gap. The national average has remained stable, with only slight year-to-year fluctuations. Most other states—including Queensland, South Australia, and Western Australia—have maintained steady but lower results, suggesting a need for renewed focus on numeracy development outside the leading states.
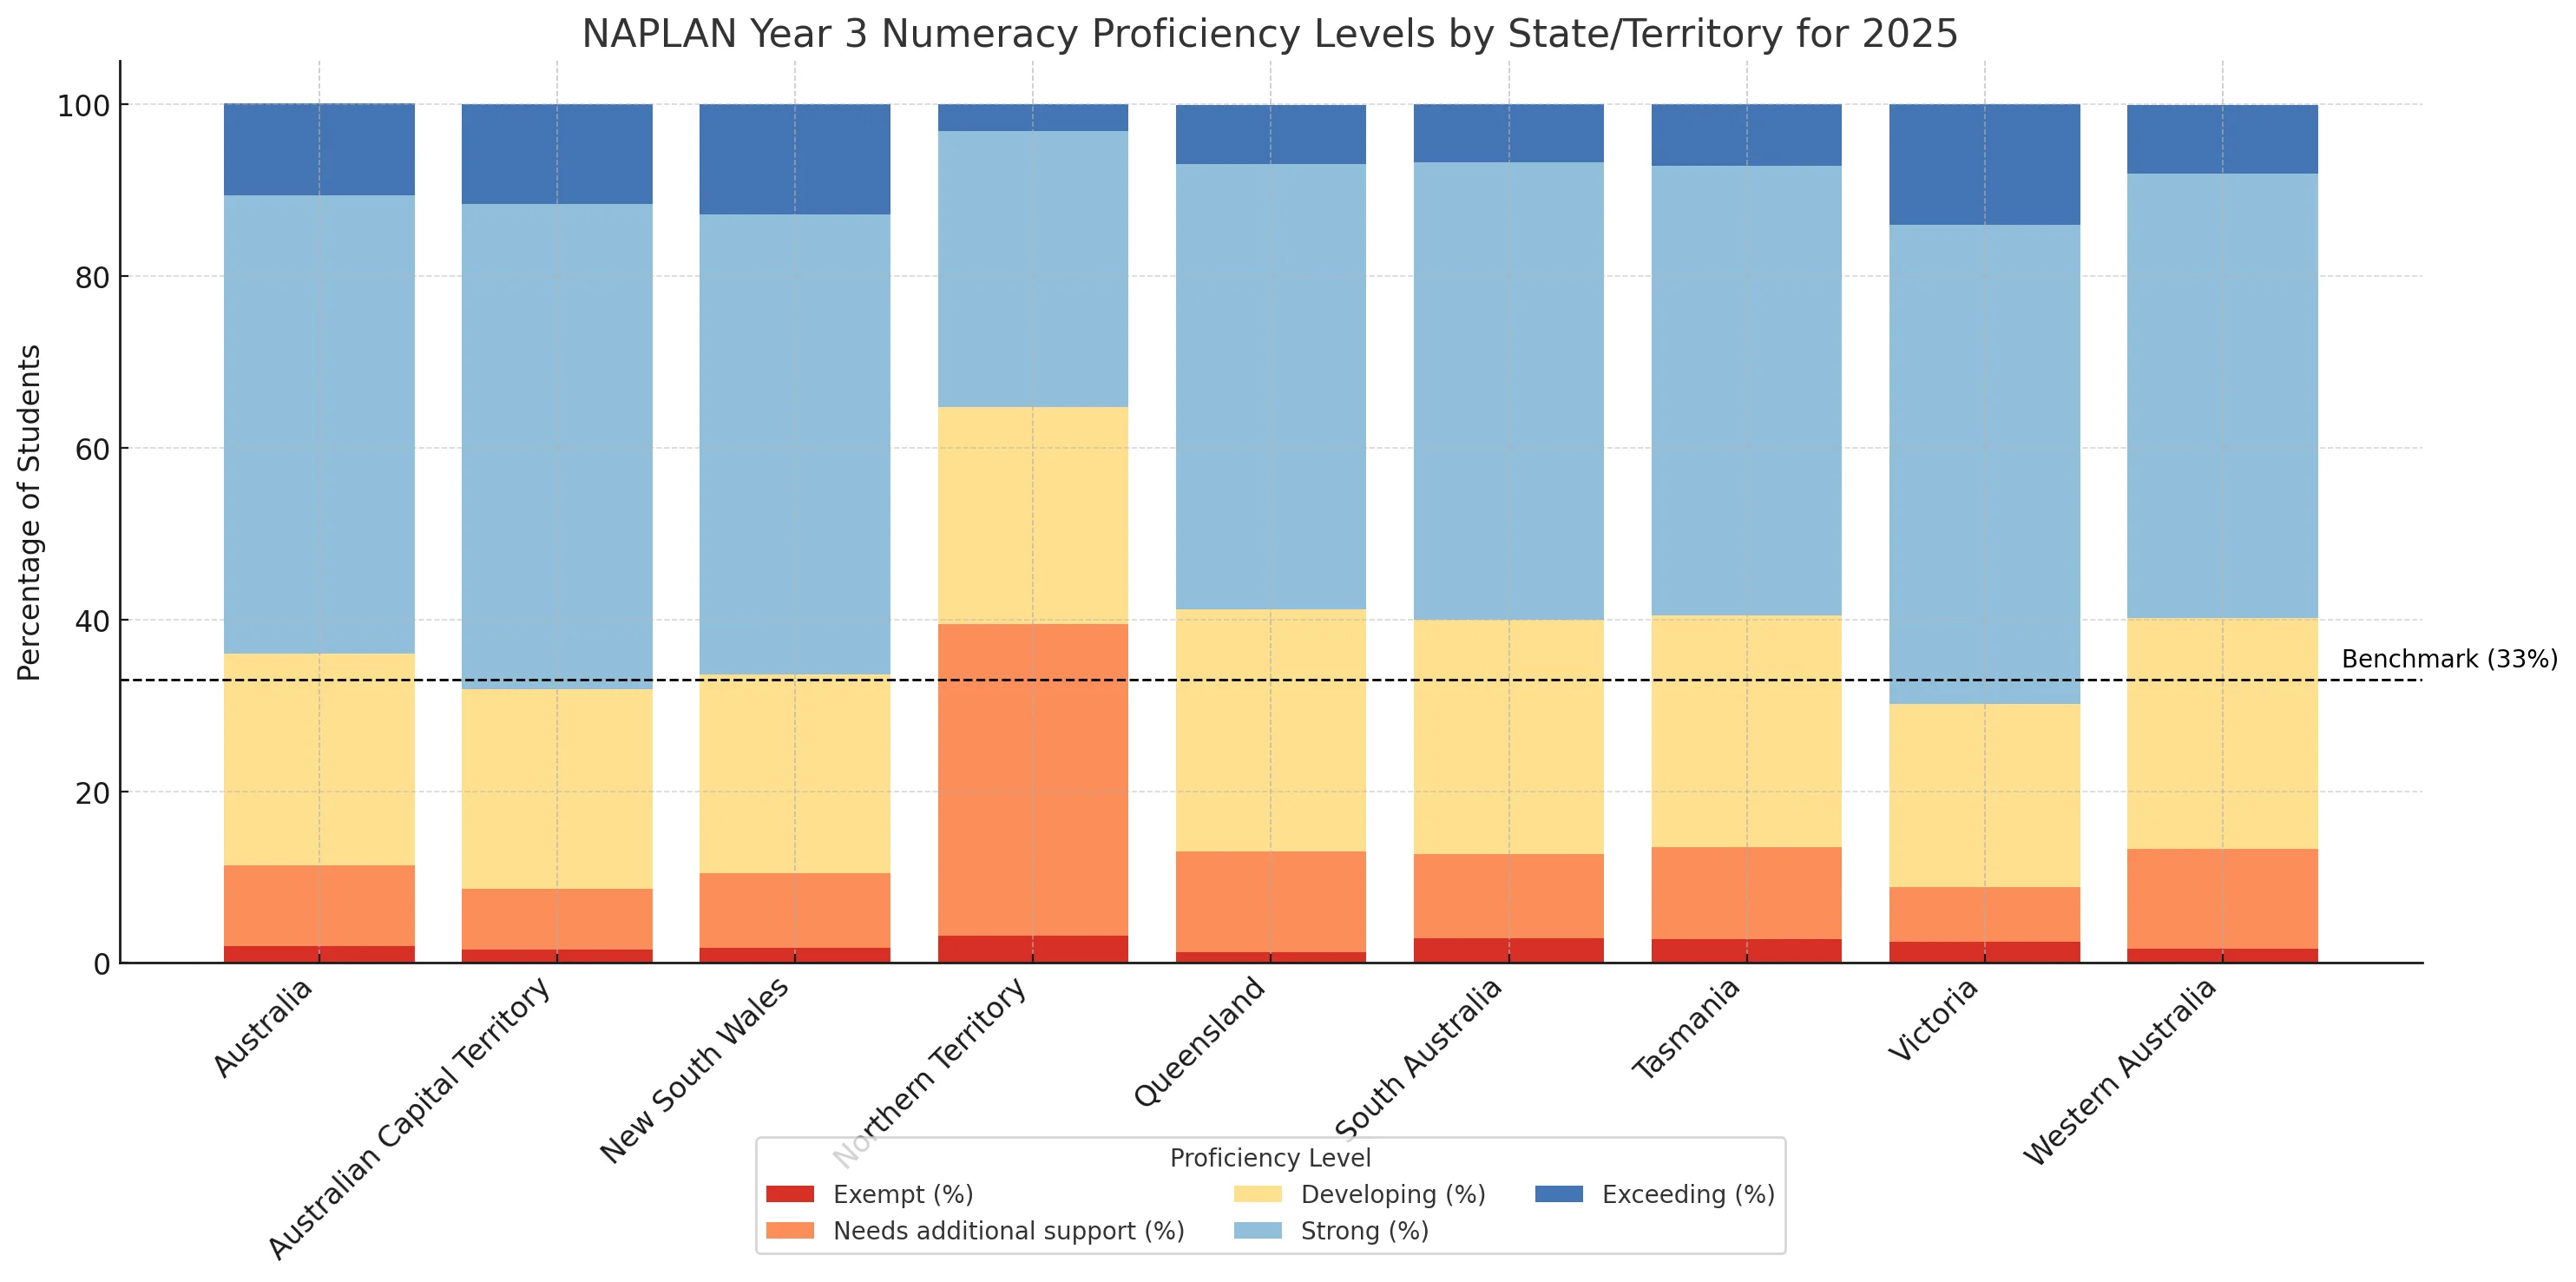
The national picture shows that over 64% of students are achieving in the Strong or Exceeding categories, though this varies significantly by state. Victoria and the ACT continue to lead in top-end performance, with Victoria recording the highest proportion of students in the Exceeding band at 14%. On the other hand, the Northern Territory again stands out for its challenges, with over 39% of students either exempt or needing additional support, and just 3.1% in the Exceeding category. While most other states have relatively balanced distributions, Queensland, Tasmania, and South Australia have slightly higher proportions in the Developing and Needs Support bands, suggesting areas for focused intervention.
Final thoughts
Writing stands out as the strongest performing domain, with over three-quarters of Year 3 students achieving in the Strong or Exceeding categories. In contrast, Spelling and Numeracy lag slightly behind, not necessarily in average scores but in the depth of excellence and percentage of students reaching the top bands. While most domains reflect a stable national picture, there is a clear opportunity to lift more students into the Exceeding level, especially in technical skills like Spelling and Numeracy.


