
This worksheet introduces compound events, teaching students to use two-way tables, tree diagrams and Venn diagrams to determine probabilities for two related events. The worksheet is split into warm-up questions, standard questions and then extension questions to test you.
The concepts it covers:
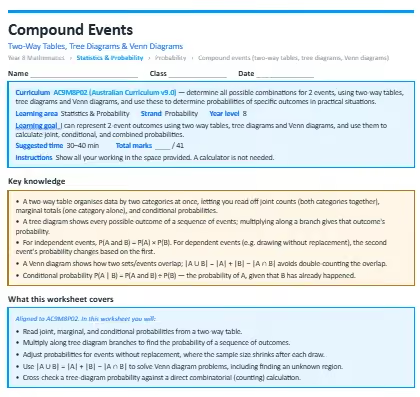
- A two-way table organises data by two categories at once, letting you read off joint counts (both categories together), marginal totals (one category alone), and conditional probabilities.
- A tree diagram shows every possible outcome of a sequence of events; multiplying along a branch gives that outcome's probability.
- For independent events, P(A and B) = P(A) × P(B). For dependent events (e.g. drawing without replacement), the second event's probability changes based on the first.
- A Venn diagram shows how two sets/events overlap; |A ∪ B| = |A| + |B| − |A ∩ B| avoids double-counting the overlap.
- Conditional probability P(A | B) = P(A and B) ÷ P(B) — the probability of A, given that B has already happened.
What your child will practise:
- Reading joint, marginal, and conditional probabilities from a two-way table.
- Multiplying along tree diagram branches to find the probability of a sequence of outcomes.
- Adjusting probabilities for events without replacement, where the sample size shrinks after each draw.
- Using |A ∪ B| = |A| + |B| − |A ∩ B| to solve Venn diagram problems, including finding an unknown region.
- Cross-checking a tree-diagram probability against a direct combinatorial (counting) calculation.
Every section opens with a worked example, and the download includes a full answer key with step-by-step solutions and teaching notes on the mistakes students most commonly make.
.avif)
.webp)


.webp)
%20(1).webp)

