
This worksheet builds understanding of sampling, teaching students to calculate proportions from repeated random samples and see how increasing sample size reduces the variation between them. The worksheet is split into warm-up questions, standard questions and then extension questions to test you.
The concepts it covers:
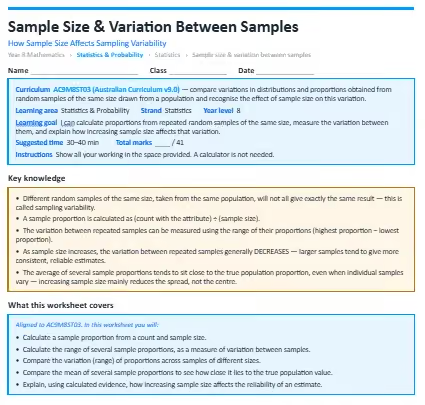
- Different random samples of the same size, taken from the same population, will not all give exactly the same result — this is called sampling variability.
- A sample proportion is calculated as (count with the attribute) ÷ (sample size).
- The variation between repeated samples can be measured using the range of their proportions (highest proportion − lowest proportion).
- As sample size increases, the variation between repeated samples generally decreases — larger samples tend to give more consistent, reliable estimates.
- The average of several sample proportions tends to sit close to the true population proportion, even when individual samples vary — increasing sample size mainly reduces the spread, not the centre.
What your child will practise:
- Calculating a sample proportion from a count and sample size.
- Calculating the range of several sample proportions, as a measure of variation between samples.
- Comparing the variation (range) of proportions across samples of different sizes.
- Comparing the mean of several sample proportions to see how close it lies to the true population value.
- Explain,ing using calculated evidence, how increasing sample size affects the reliability of an estimate.
Every section opens with a worked example, and the download includes a full answer key with step-by-step solutions and teaching notes on the mistakes students most commonly make.

.webp)


.webp)
%20(1).webp)

