
This worksheet teaches students to compare a simple event's probability to a related compound "at least one" event, using both theoretical calculation and simulated data. The worksheet is split into warm-up questions, standard questions and then extension questions to test you.
The concepts it covers:
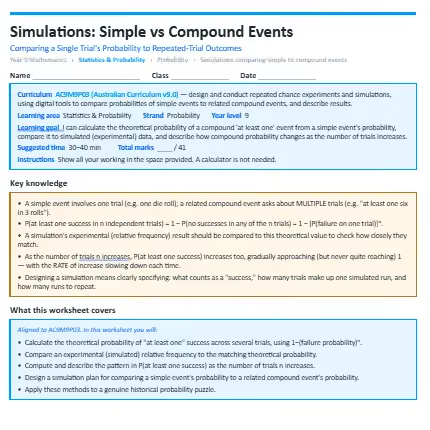
- A simple event involves one trial (e.g. one die roll); a related compound event asks about multiple trials (e.g. "at least one six in 3 rolls").
- P(at least one success in n independent trials) = 1 − P(no successes in any of the n trials) = 1 − [P(failure on one trial)]ⁿ.
- A simulation's experimental (relative frequency) result should be compared to this theoretical value to check how closely they match.
- As the number of trials n increases, P(at least one success) increases too, gradually approaching (but never quite reaching) 1 — with the rate of increase slowing down each time.
- Designing a simulation means clearly specifying: what counts as a "success," how many trials make up one simulated run, and how many runs to repeat.
What your child will practise:
- Calculating the theoretical probability of "at least one" success across several trials, using 1−(failure probability)ⁿ.
- Comparing an experimental (simulated) relative frequency to the matching theoretical probability.
- Computing and describe the pattern in P(at least one success) as the number of trials n increases.
- Designing a simulation plan for comparing a simple event's probability to a related compound event's probability.
- Applying these methods to a genuine historical probability puzzle.
Every section opens with a worked example, and the download includes a full answer key with step-by-step solutions and teaching notes on the mistakes students most commonly make.
.webp)


.webp)
%20(1).webp)

