


Every year, the VCAA examiner reports give us an unusually honest window into how students actually performed — not just what was tested, but where students consistently succeeded or struggled. In this section, we’ll break down how the VCE General Mathematics examination is structured, clarify the differences between Exam 1 and Exam 2, and use the 2025 examiner data to highlight what future students should prioritise (and what they should be careful not to underestimate).
This analysis draws directly on the General Mathematics Study Design (2023–2027) and the official 2025 examiner reports for both examinations .
Overview of the VCE General Mathematics Exams
VCE General Mathematics Units 3 & 4 are assessed using two external examinations, each designed to test different mathematical skills.
At a high level:
- Paper 1 focuses on knowledge, fluency, and decision-making under time pressure
- Paper 2 focuses on reasoning, interpretation, communication, and multi-step problem solving
Both exams assume full access to approved CAS technology, but how that technology is used — and how much thinking happens before pressing buttons — differs significantly.
Paper 1 vs Paper 2: Key Differences
In short: Paper 1 asks “Can you choose and execute the right method?”
Paper 2 asks “Can you explain, interpret, and justify that method?”
Question Breakdown for VCE General Mathematics Examination 1
To help students better understand the structure of the VCE General Mathematics Examination 1, this section maps each question to its respective topic and provides short description of the question as well.
What were the easiest and hardest questions?
The easiest three questions were:
Question 28 on Networks (98% got this correct)
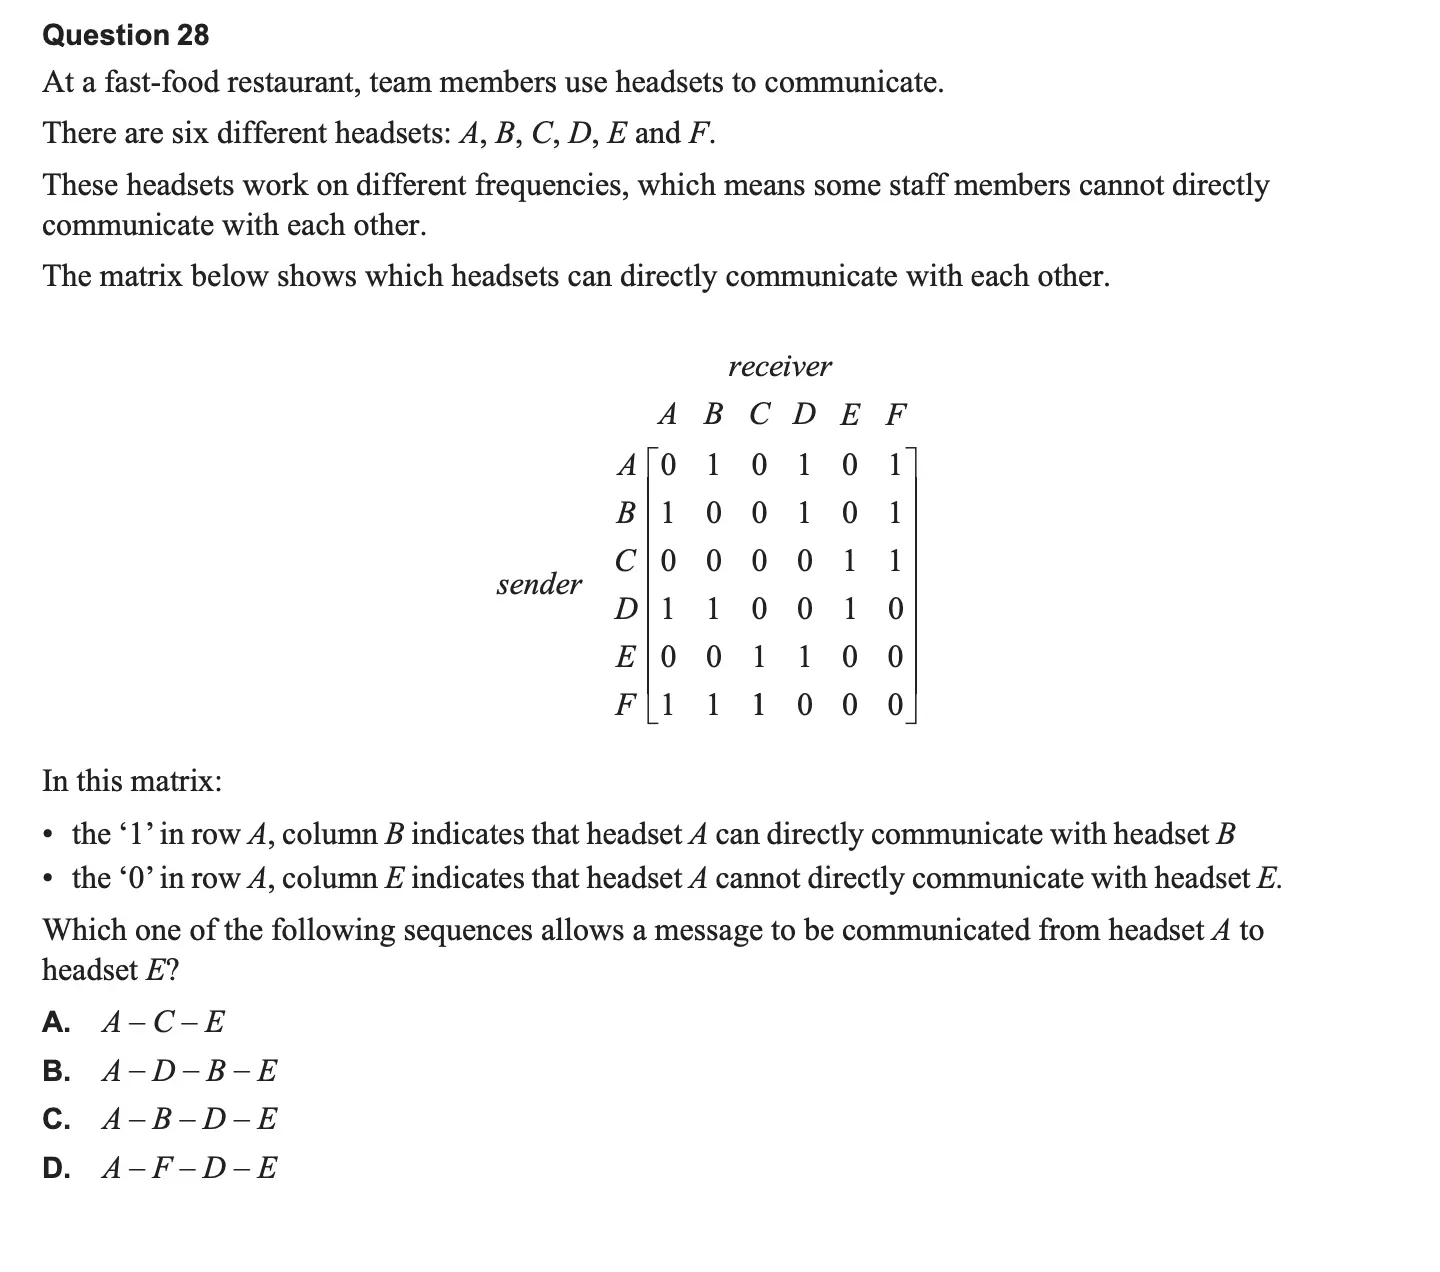
Answer: C
Check each option:A does not directly communicate with C. Eliminate option A.B does not directly communicate with E. Eliminate option B.All direct links work.F does not directly communicate with D. Eliminate option D.
Question 7 on Data Analysis (86% got this correct)
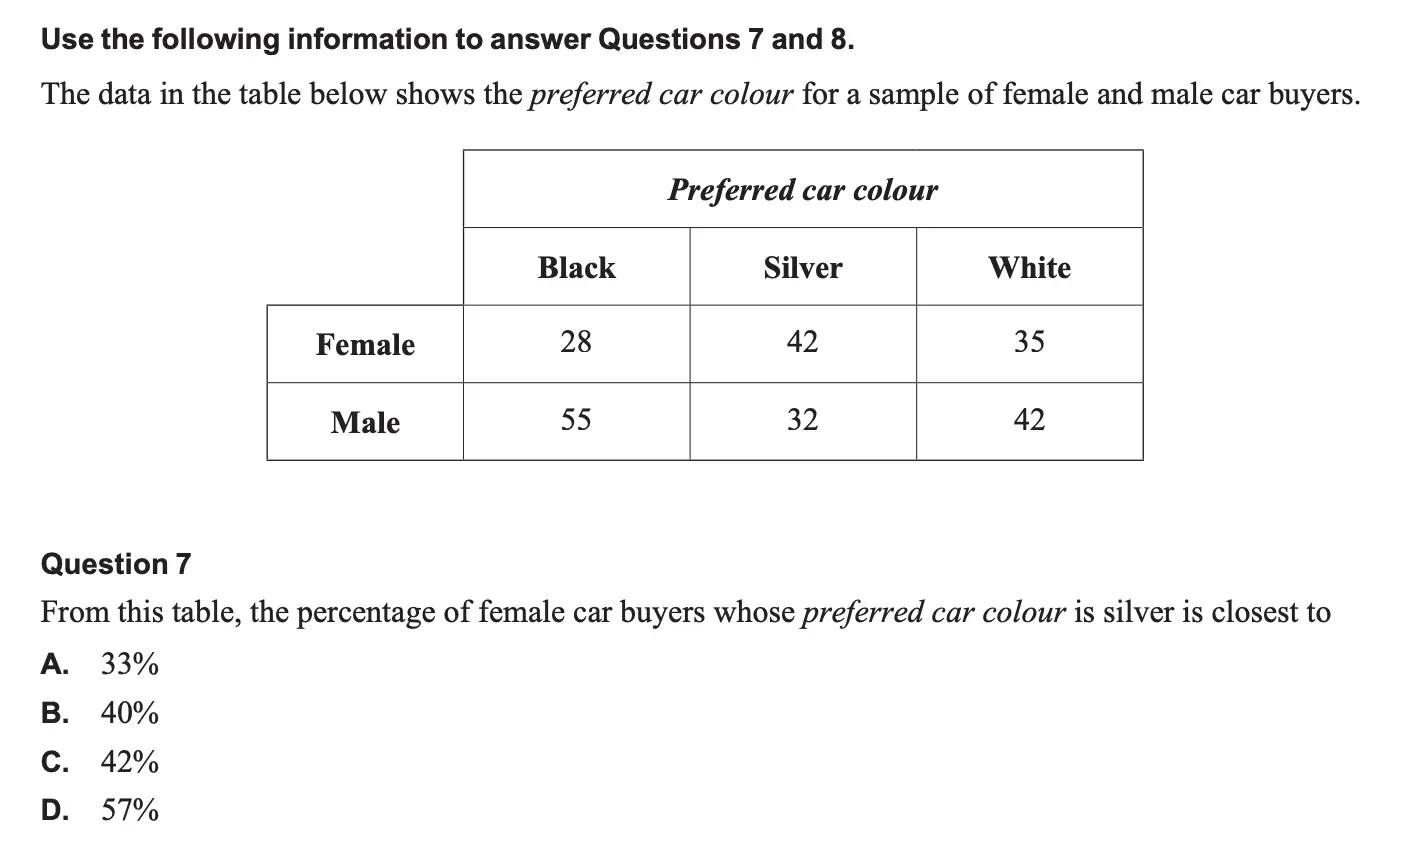
Answer: B
42 ÷ (28 + 42 + 35) = 40%
Question 14 on Data Analysis (85% got this correct)
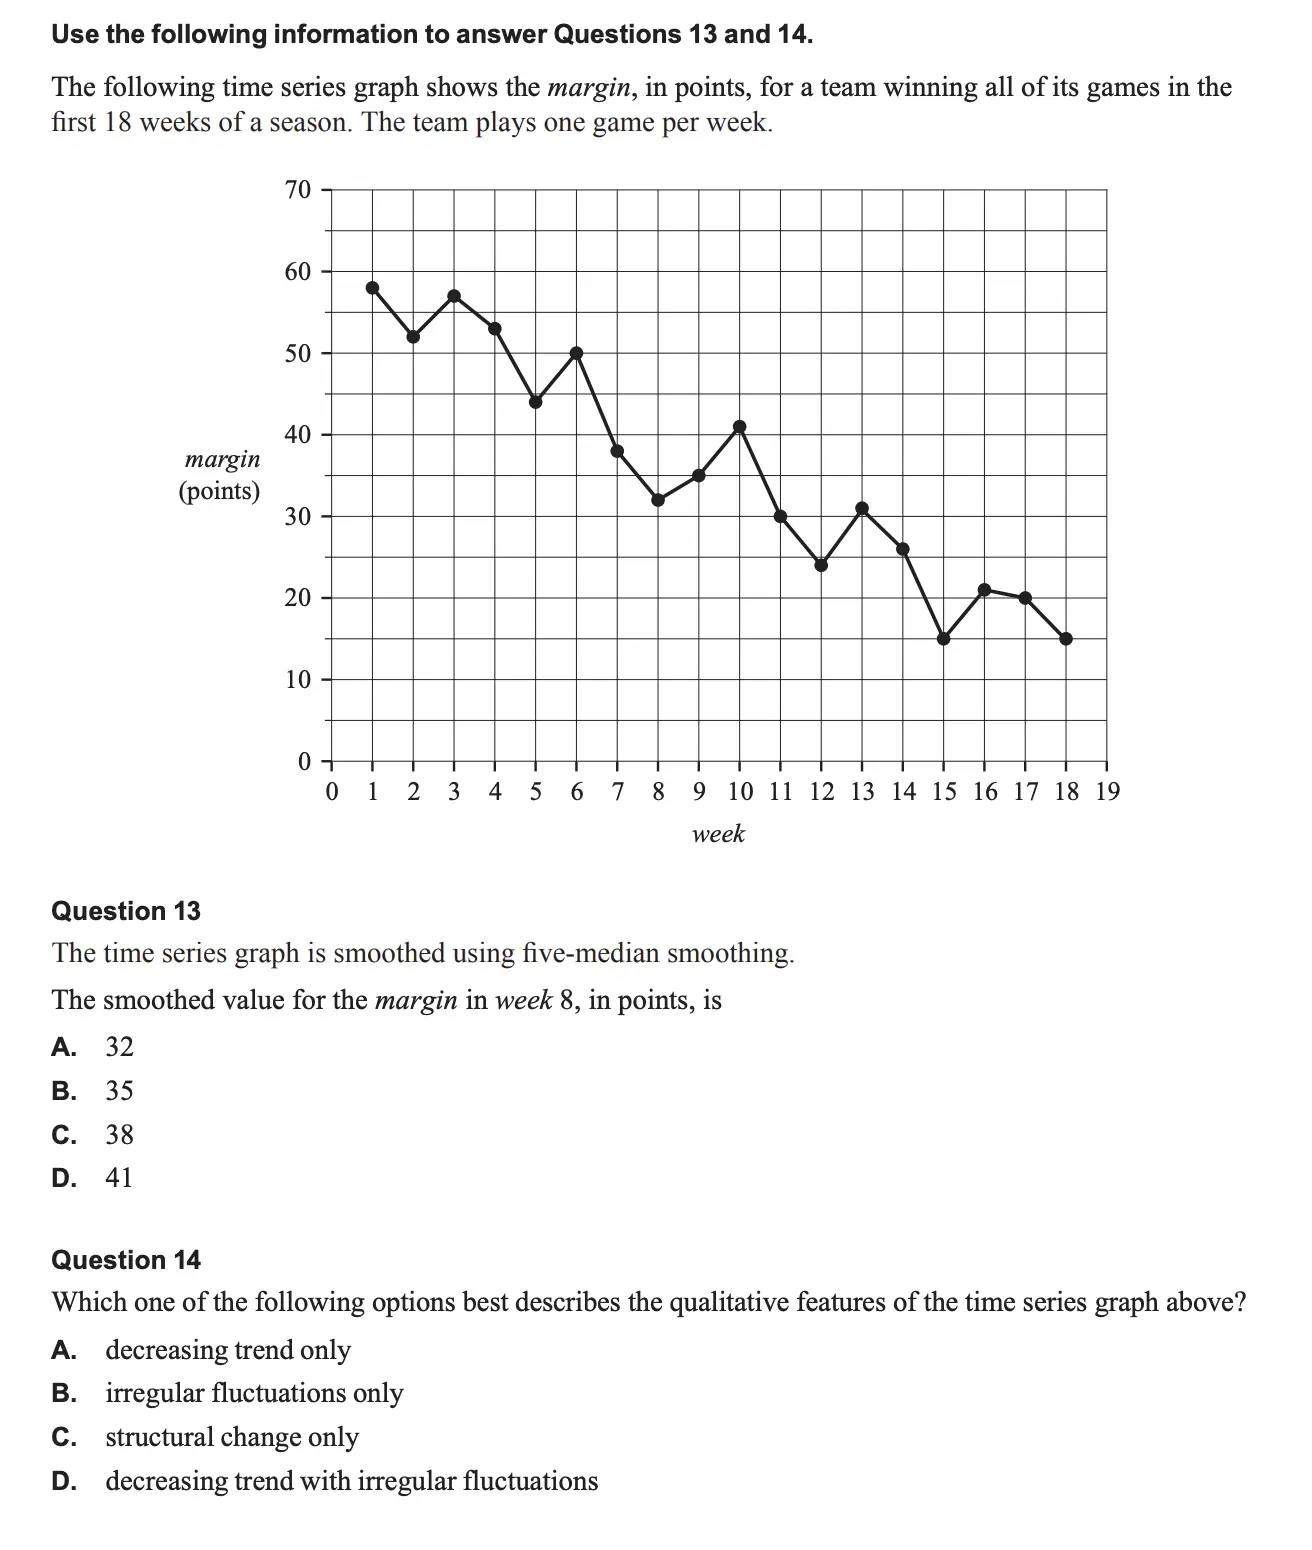
Answer: D
Time series shows decreasing trend with irregular fluctuations
The hardest three questions were:
Question 23 on Recursion & Finance (41% got this correct)
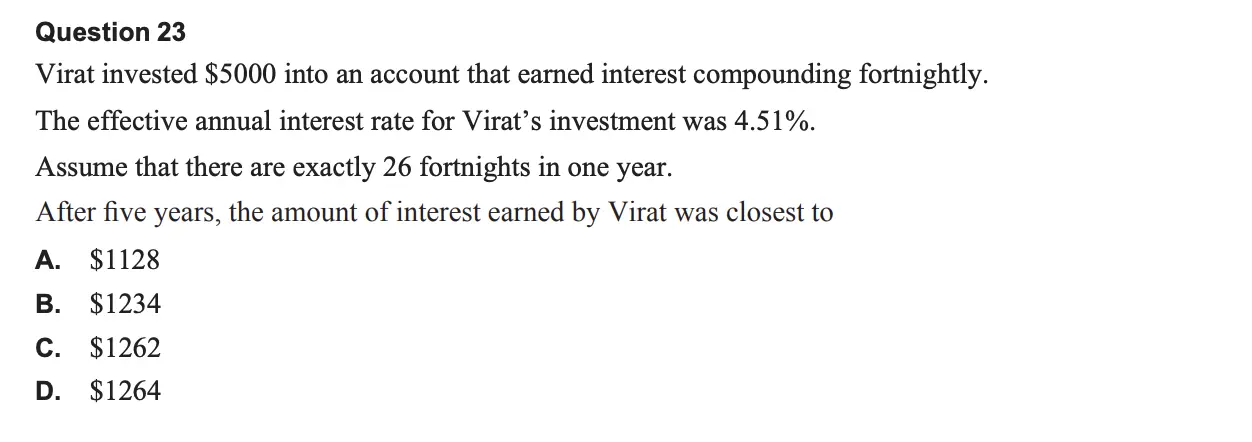
Answer: B
Step 1. The nominal interest rate = nom(4.51,26) = 4.415% p.a.
Step 2. Use Finance Solver to find total balance, where,
N = 5 × 26, I% = 4.415, PV = −5000, Pmt = 0, CpY = PpY = 26
Solve for FV. FV = $6233.8910… ≈ $6233.89
Step 3. The interest earned = $6233.89 − $5000 = $1233.89 ≈ $1234
Question 38 on Networks (47% got this correct)
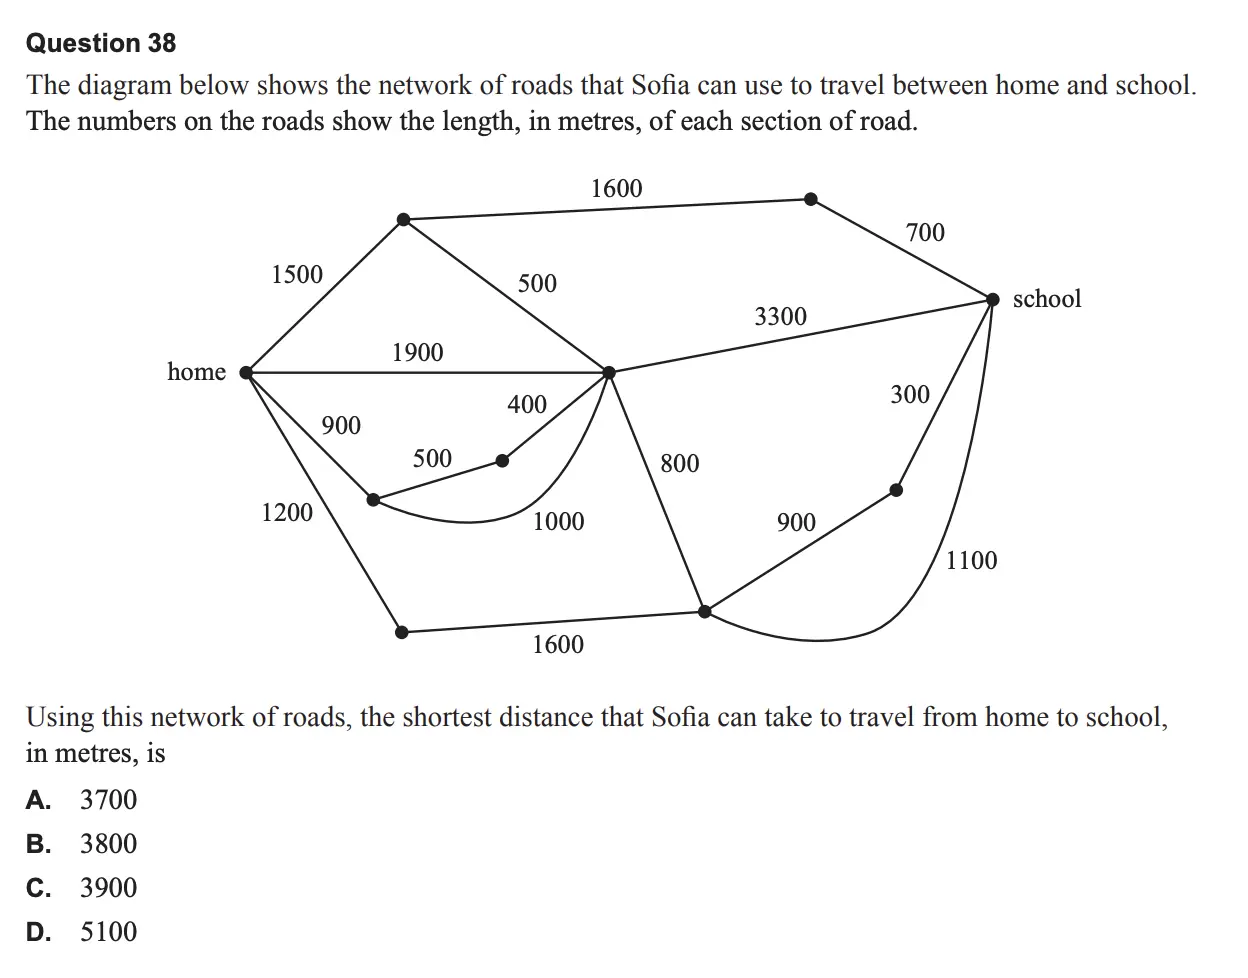
Answer: A
The shortest path is 900 + 500 + 400 + 800 + 1100 = 3700
Question 19 on Recursion & Finance
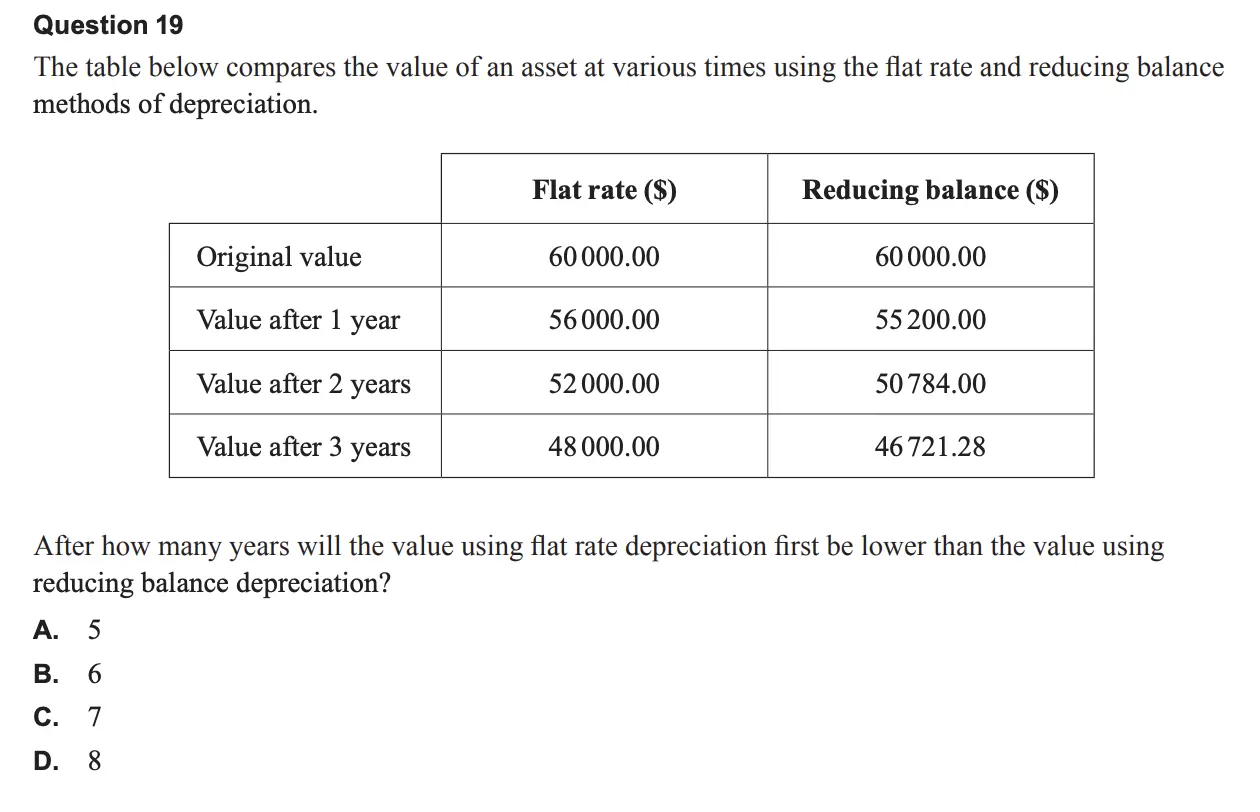
Answer B:
Two possible methods include:
- Continue the table using a flat rate deduction of $4000 per year and a reducing balance factor of 0.92, or
- Solve 60 000 − 4000n = 60 000 × 0.92n for n which givesn = 5.582…The value using flat rate depreciation will first be lower after 6 years.
Which topic was the hardest in the General Maths Paper 1 2025 exam?
Using the percentage of students who selected the correct answer for each question, we can calculate the average success rate per topic.
👉 Key takeaway:
Recursion & Financial Modelling was, by a long way, the weakest topic overall.
Question Breakdown for VCE General Mathematics Examination 2
While Exam 1 rewards speed and selection, Exam 2 is where conceptual understanding, interpretation, and mathematical communication are tested. By separating the questions into 1-mark and 2-mark tasks, we can clearly see what skills VCAA expects students to execute instantly versus where deeper reasoning is required.
What were the easiest and hardest questions?
The easiest three questions were:
Question 11a on Matrices (96% got this correct)
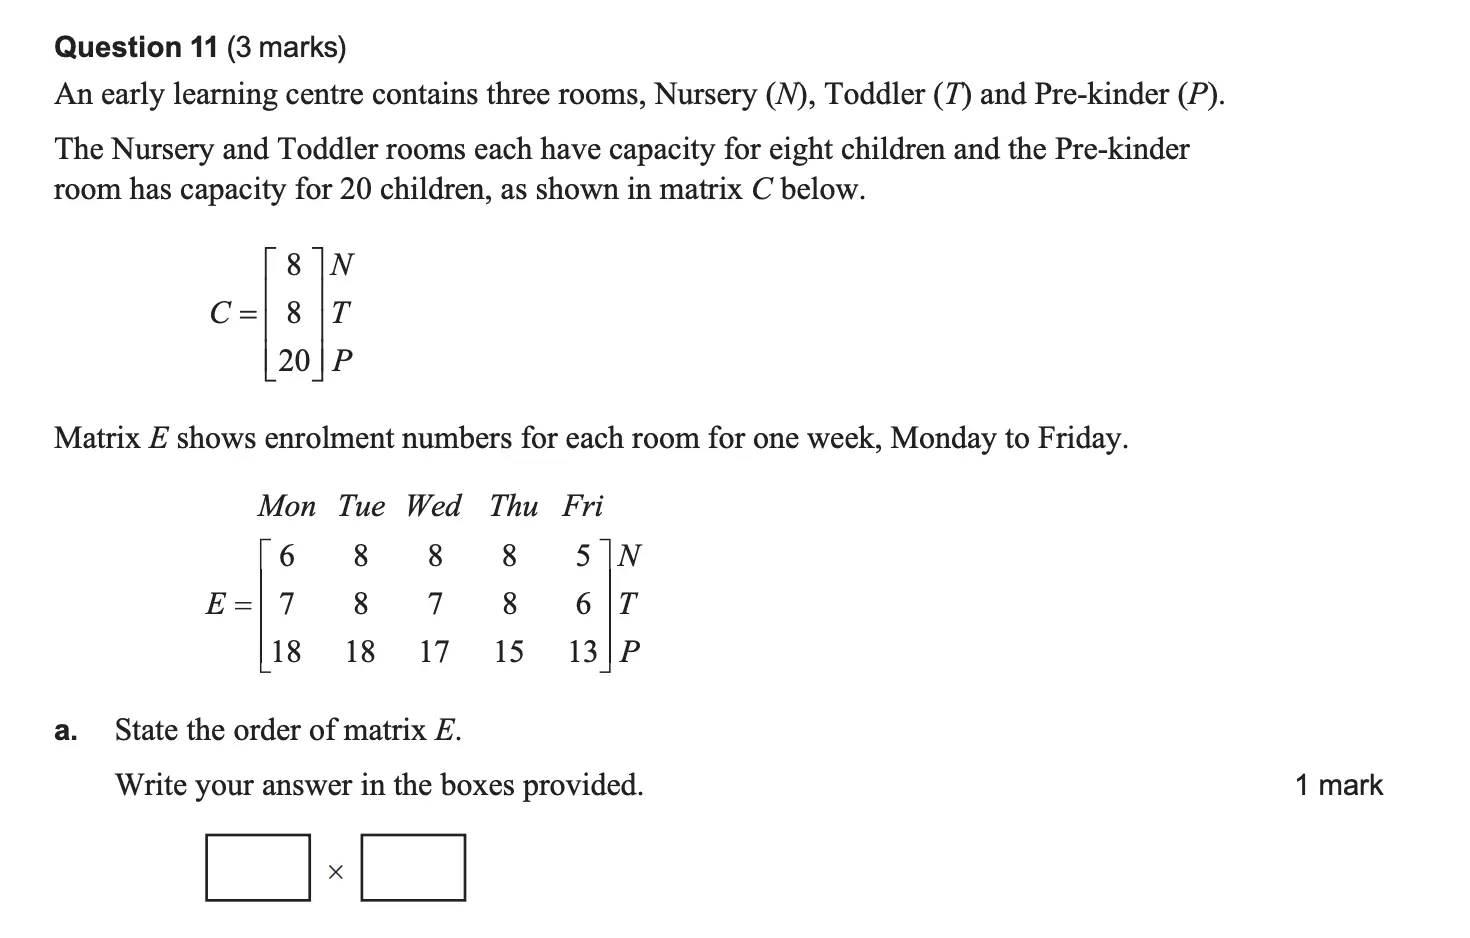
Answer:
3 x 5
Question 7a on Recursion and Finance (93% got this correct)
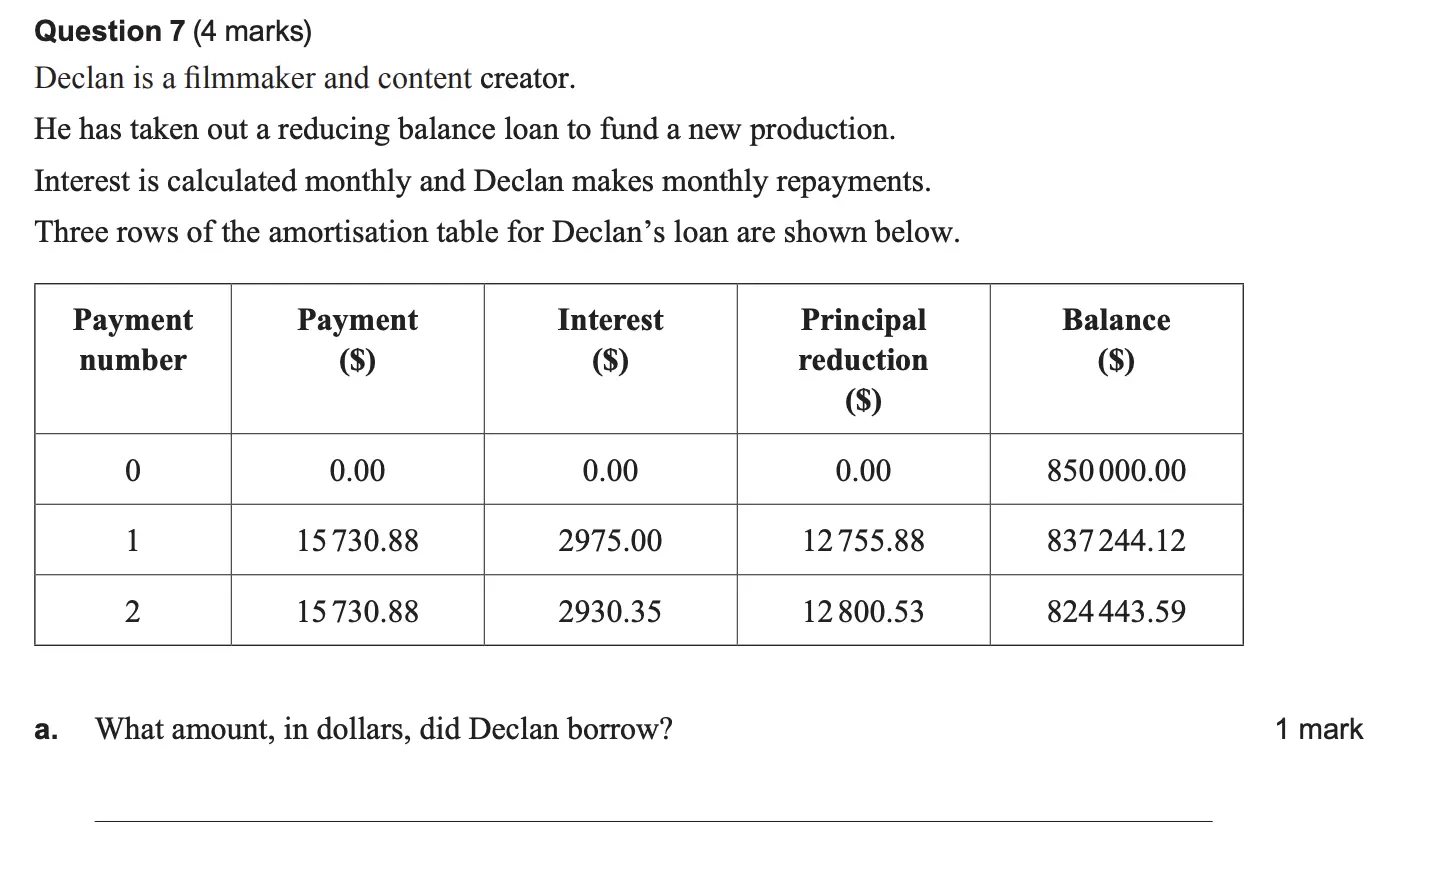
Answer:
$850,000
Question 15b on Networks (91% got this correct)
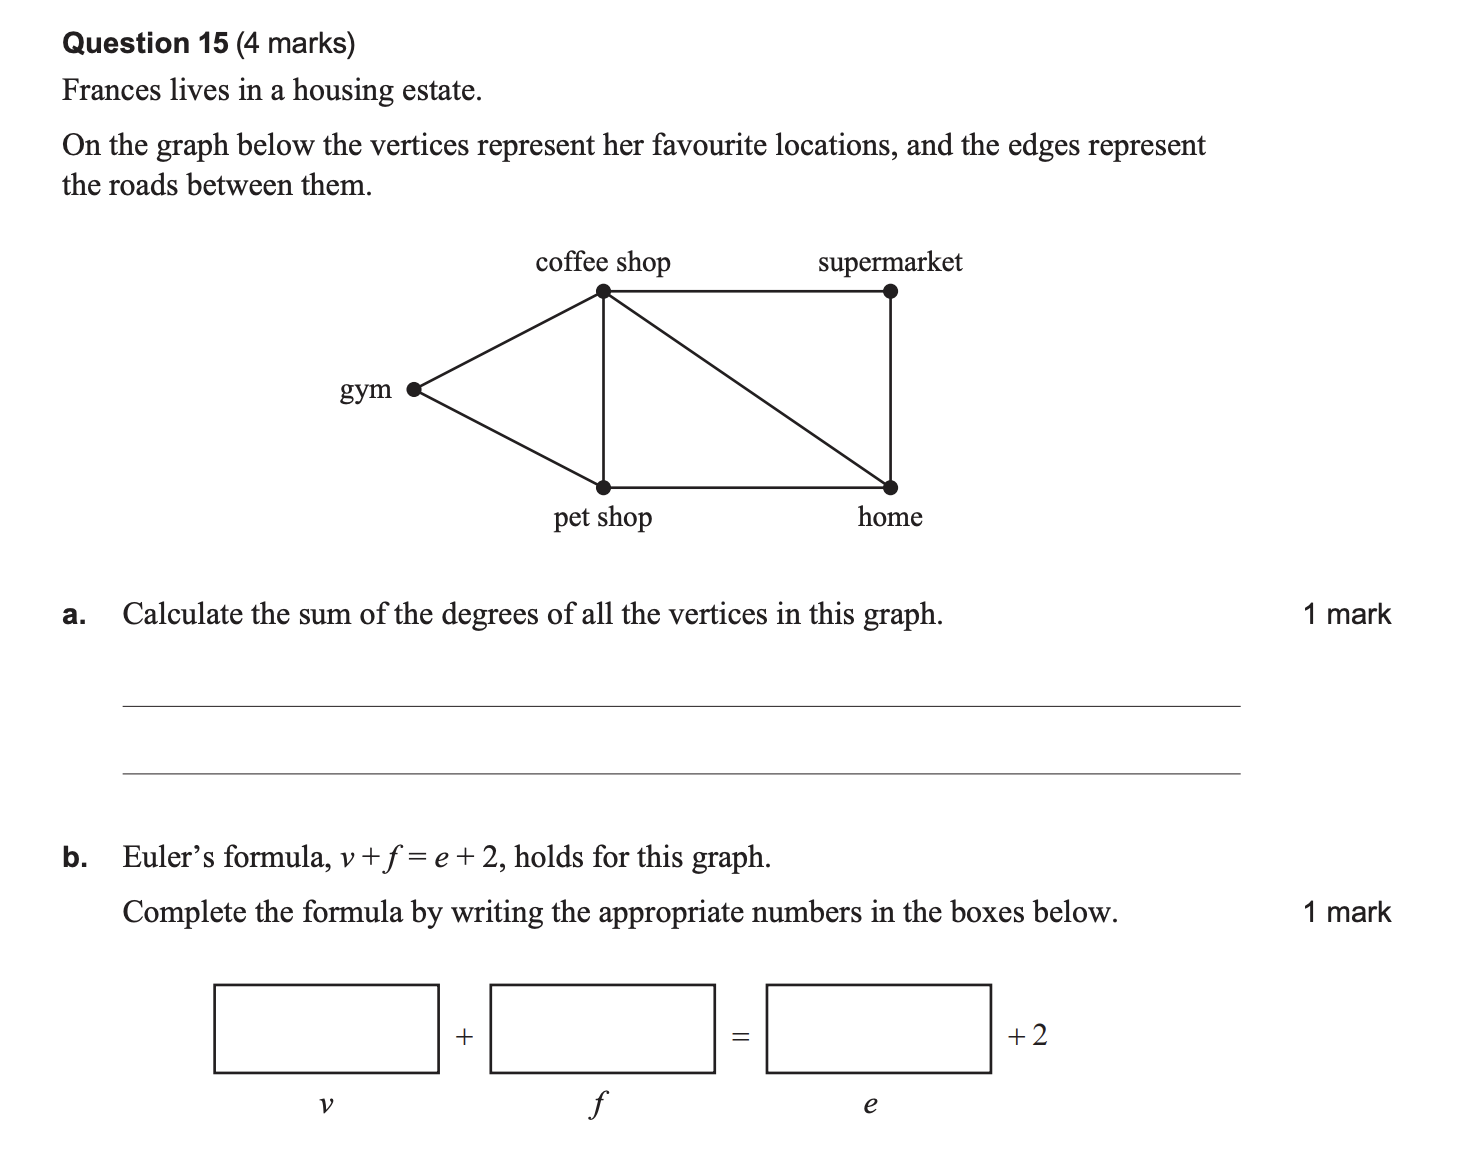
Answer:
5 + 4 = 7 + 2
The three hardest questions were
Question 6b on Data Analysis (12% got full marks)
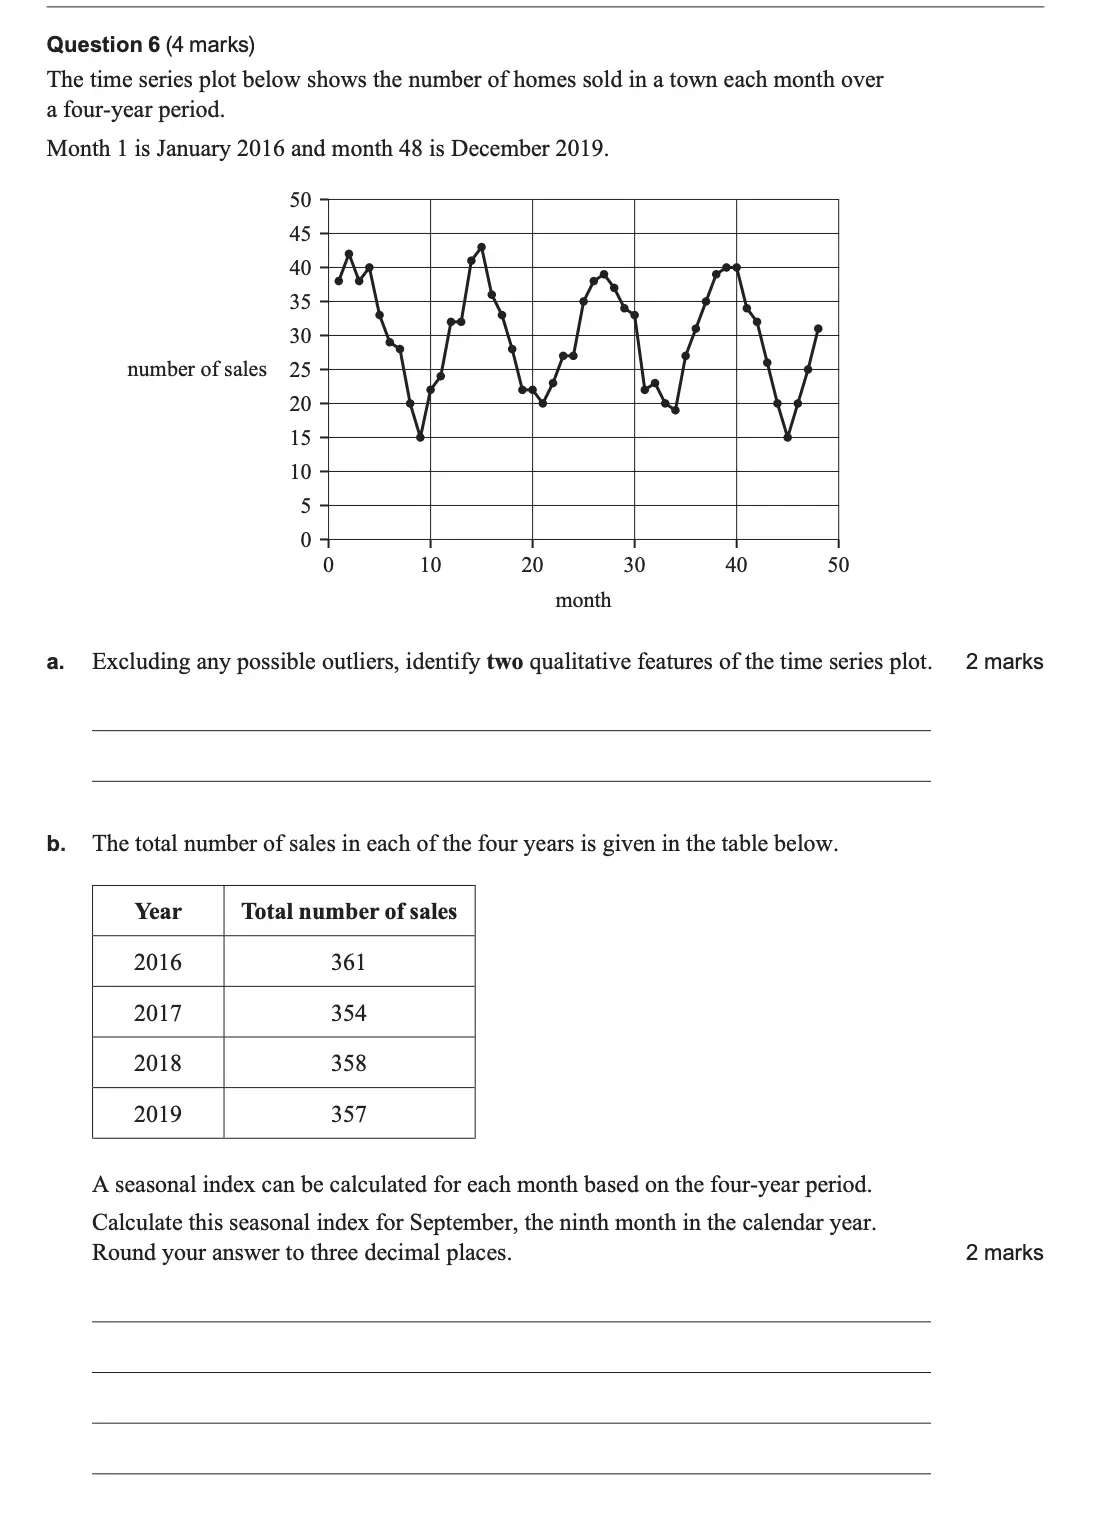
Answer:
Two different approaches were permitted here that gave almost identical answers.
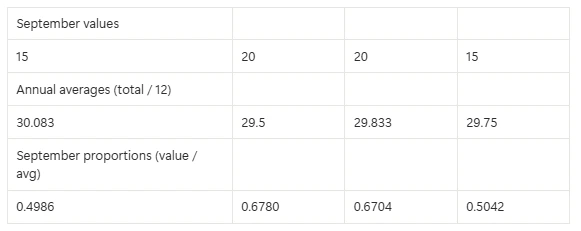
Seasonal Index = (0.4986 + 0.6780 + 0.6704 + 0.5042) / 4
= 0.588
OR
Averages:
Sept = (15 + 20 + 20 + 15) / 4 = 17.5
Totals = (361 + 354 + 358 + 357) / 48 = 29.79…
Seasonal Index (Sept) = 17.5 / 29.79…
= 0.587
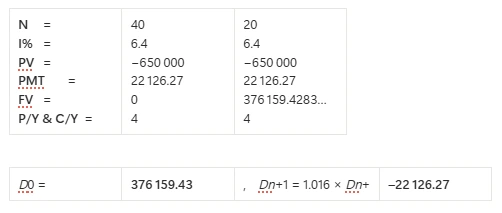
Question 10 on Recursion & Finance (11% got full marks)
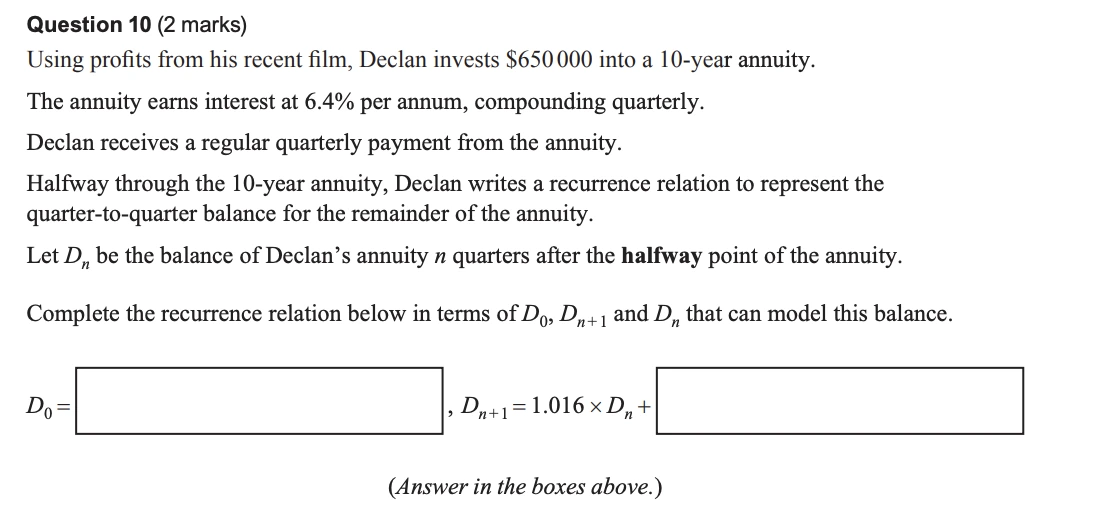
Finance solver entries
Question 13bii on Matrics (17% got full marks)
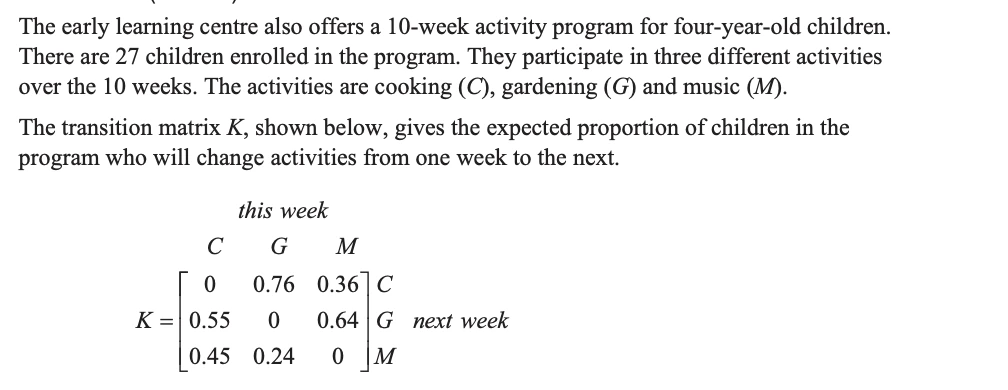
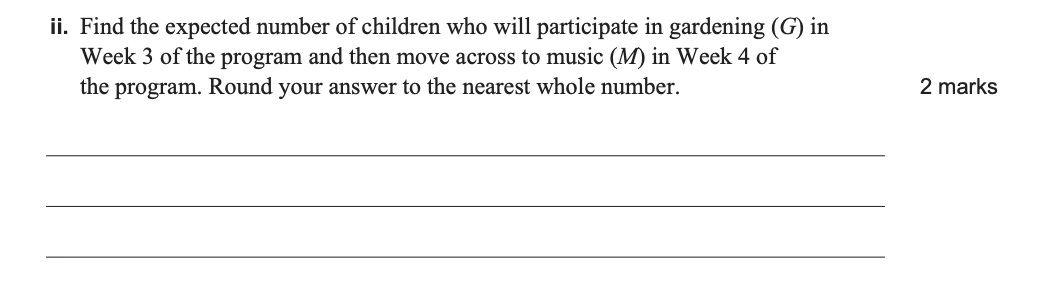
Answer:
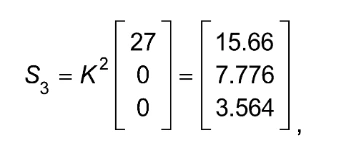
7.776 × 0.24
= 2
Which topic was the hardest in the General Maths Paper 2 2025 exam?
To identify the hardest topic, we calculate the average full-mark rate per topic, weighted by question type.
Topic Averages (Exam 2)
Insights from Examiners for the General Maths Exam
The examiner report makes one message very clear: most marks in General Maths are lost through interpretation, imprecision, and misuse of technology, not because the maths itself is too difficult. Across topics, students who understood what the mathematics represented consistently outperformed those who focused only on procedures.
Data Analysis
Data Analysis was the most heavily examined area, and while many students showed solid technical ability, interpretation remained a major weakness.
- Students were generally comfortable calculating statistics such as medians, standard deviations, residuals, and regression values, but many struggled to explain what those values meant in context, particularly when interpreting regression slopes, extrapolation, and coefficients of determination.
- A very common error was ignoring the sign of the slope in regression questions, with many students correctly identifying the magnitude but failing to recognise that a negative slope changes the interpretation entirely.
- Examiners repeatedly stressed that interpolation and extrapolation depend on the explanatory variable, not whether the predicted value “looks reasonable”, yet many students referred incorrectly to the response variable instead.
- In time series questions, students often identified trends or seasonality correctly, but marks were lost when formal terminology from the study design was not used, even when the idea was correct.
- Multi-step questions involving seasonal indices or normal distributions showed that students frequently rounded too early, despite explicit instructions not to do so, leading to otherwise avoidable mark losses.
Key takeaway:
Being able to calculate is not enough, students must practise explaining statistical results clearly, precisely, and using correct study-design language.
Recursion & Financial Modelling
This was the weakest topic overall, and examiner commentary here was the most critical.
- Many students relied heavily on the finance solver without understanding the underlying model, resulting in answers that were technically calculated but mathematically inappropriate for the question being asked.
- A persistent issue was confusion between recursive rules and explicit formulas, with some students giving essentially the same expression twice, showing a lack of conceptual distinction.
- Errors were especially common when interpreting interest rates, particularly distinguishing between nominal rates, effective rates, and growth factors, even when formulas were provided.
- In loan and depreciation questions, students often selected correct values but failed to interpret them correctly, for example giving repayments with the wrong sign or misunderstanding what a balance represented.
- Examiners repeatedly noted that students who followed tables and question instructions carefully performed far better than those who attempted to “shortcut” using technology.
Key takeaway:
This topic rewards conceptual understanding over button-pressing, and students must know what each variable represents before reaching for CAS.
Matrices
Matrices was one of the strongest topics overall, but examiner comments still reveal important lessons.
- Students generally performed well on procedural tasks such as matrix multiplication and identifying matrix types, particularly when dimensions and definitions were checked carefully.
- Marks were commonly lost in contextual matrix questions when students summed rows instead of columns (or vice versa), indicating that interpretation, not calculation, was the issue.
- Questions involving identity matrices exposed a shallow understanding, with many students applying operations mechanically without recognising that an identity matrix leaves values unchanged.
- In expected value questions, students often lost all marks by providing a final answer without working, despite the question clearly being worth multiple marks.
Key takeaway:
Matrices is reliable scoring territory, but context matters, and students must slow down and connect the matrix operation to what it represents.
Networks & Decision Mathematics
Networks was a relative strength, especially for visual and identification tasks, but weaknesses emerged as complexity increased.
- Students performed very well on identifying Hamiltonian paths, Eulerian properties, and simple network totals, showing strong familiarity with definitions and visual structures.
- Errors increased noticeably in optimisation questions involving critical paths, floats, and time–cost trade-offs, particularly when multiple steps were required.
- A recurring issue was students providing extra, incorrect information, which cost marks even when the core answer was correct.
- Arithmetic accuracy under time pressure was a significant factor, with some students understanding the method but losing marks due to small calculation errors.
Key takeaway:
Understanding network concepts is not enough, discipline, accuracy, and restraint are essential once calculations are involved.


