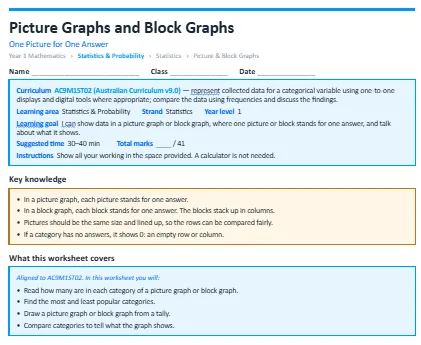
This worksheet teaches students to read and draw picture graphs and block graphs where one picture stands for one answer, and to say what the graph shows. The worksheet is split into warm-up questions, standard questions and then extension questions to test you.
The concepts it covers:
- In a picture graph, each picture stands for one answer.
- In a block graph, each block stands for one answer. The blocks stack up in columns.
- Pictures should be the same size and lined up, so the rows can be compared fairly.
- If a category has no answers, it shows 0: an empty row or column.
What your child will practise:
- Reading how many are in each category of a picture graph or block graph.
- Finding the most and least popular categories.
- Drawing a picture graph or block graph from a tally.
- Comparing categories to tell what the graph shows.
Every section opens with a worked example, and the download includes a full answer key with step-by-step solutions and teaching notes on the mistakes students most commonly make.