
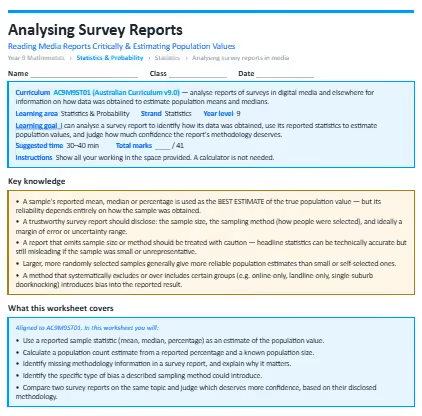
This worksheet builds statistical literacy, teaching students to critically analyse survey reports and use reported statistics to estimate population values. The worksheet is split into warm-up questions, standard questions and then extension questions to test you.
The concepts it covers:
- A sample's reported mean, median or percentage is used as the best estimate of the true population value — but its reliability depends entirely on how the sample was obtained.
- A trustworthy survey report should disclose: the sample size, the sampling method (how people were selected), and ideally a margin of error or uncertainty range.
- A report that omits sample size or method should be treated with caution — headline statistics can be technically accurate but still misleading if the sample was small or unrepresentative.
- Larger, more randomly selected samples generally give more reliable population estimates than small or self-selected ones.
- A method that systematically excludes or over-includes certain groups (e.g. online-only, landline-only, single-suburb doorknocking) introduces bias into the reported result.
What your child will practise:
- Using a reported sample statistic (mean, median, percentage) as an estimate of the population value.
- Calculating a population count estimate from a reported percentage and a known population size.
- Identifying missing methodology information in a survey report, and explain why it matters.
- Identifying the specific type of bias a described sampling method could introduce.
- Comparing two survey reports on the same topic and judge which deserves more confidence, based on their disclosed methodology.
Every section opens with a worked example, and the download includes a full answer key with step-by-step solutions and teaching notes on the mistakes students most commonly make.
.webp)


.webp)
%20(1).webp)

