
This worksheet builds statistical literacy, teaching students to calculate and compare the mean, median, mode and range of data from random and non-random samples. The worksheet is split into warm-up questions, standard questions and then extension questions to test you.
The concepts it covers:
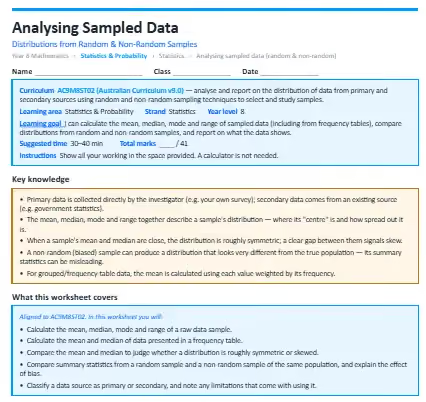
- Primary data is collected directly by the investigator (e.g. your own survey); secondary data comes from an existing source (e.g. government statistics).
- The mean, median, mode and range together describe a sample's distribution — where its "centre" is and how spread out it is.
- When a sample's mean and median are close, the distribution is roughly symmetric; a clear gap between them signals skew.
- A non-random (biased) sample can produce a distribution that looks very different from the true population — its summary statistics can be misleading.
- For grouped/frequency-table data, the mean is calculated using each value weighted by its frequency.
What your child will practise:
- Calculating the mean, median, mode and range of a raw data sample.
- Calculating the mean and median of data presented in a frequency table.
- Comparing the mean and median to judge whether a distribution is roughly symmetric or skewed.
- Comparing summary statistics from a random sample and a non-random sample of the same population, and explain the effect of bias.
- Classifying a data source as primary or secondary, and note any limitations that come with using it.
Every section opens with a worked example, and the download includes a full answer key with step-by-step solutions and teaching notes on the mistakes students most commonly make.
.webp)


.webp)
%20(1).webp)

