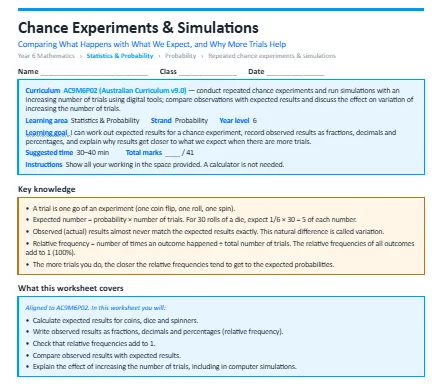
This worksheet teaches students to compare the results of chance experiments and simulations with the expected results, and to explain why results get closer to what we expect as the number of trials increases. The worksheet is split into warm-up questions, standard questions and then extension questions to test you.
The concepts it covers:
- A trial is one go of an experiment (one coin flip, one roll, one spin).
- Expected number = probability × number of trials. For 30 rolls of a die, expect 1/6 × 30 = 5 of each number.
- Observed (actual) results almost never match the expected results exactly. This natural difference is called variation.
- Relative frequency = number of times an outcome happened ÷ total number of trials. The relative frequencies of all outcomes add to 1 (100%).
- The more trials you do, the closer the relative frequencies tend to get to the expected probabilities.
What your child will practise:
- Calculating expected results for coins, dice and spinners.
- Writing observed results as fractions, decimals and percentages (relative frequency).
- Checking that relative frequencies add to 1.
- Comparing observed results with expected results.
- Explaining the effect of increasing the number of trials, including in computer simulations.
Every section opens with a worked example, and the download includes a full answer key with step-by-step solutions and teaching notes on the mistakes students most commonly make.