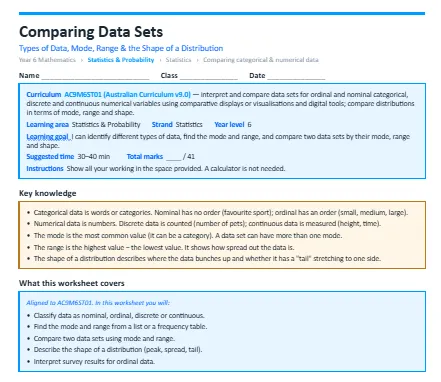
This worksheet teaches students to identify different types of data and to compare data sets using the mode, the range and the shape of each distribution. The worksheet is split into warm-up questions, standard questions and then extension questions to test you.
The concepts it covers:
- Categorical data is words or categories. Nominal has no order (favourite sport); ordinal has an order (small, medium, large).
- Numerical data is numbers. Discrete data is counted (number of pets); continuous data is measured (height, time).
- The mode is the most common value (it can be a category). A data set can have more than one mode.
- The range is the highest value − the lowest value. It shows how spread out the data is.
- The shape of a distribution describes where the data bunches up and whether it has a "tail" stretching to one side.
What your child will practise:
- Classifying data as nominal, ordinal, discrete or continuous.
- Finding the mode and range from a list or a frequency table.
- Comparing two data sets using mode and range.
- Describing the shape of a distribution (peak, spread, tail).
- Interpreting survey results for ordinal data.
Every section opens with a worked example, and the download includes a full answer key with step-by-step solutions and teaching notes on the mistakes students most commonly make.