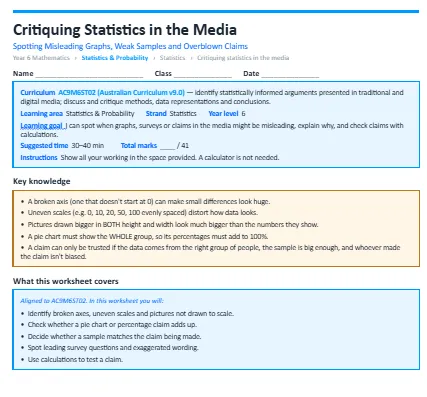
This worksheet builds statistical literacy, teaching students to spot misleading graphs, weak samples and exaggerated claims in the media, and to test claims with their own calculations. The worksheet is split into warm-up questions, standard questions and then extension questions to test you.
The concepts it covers:
- A broken axis (one that doesn't start at 0) can make small differences look huge.
- Uneven scales (e.g. 0, 10, 20, 50, 100 evenly spaced) distort how data looks.
- Pictures drawn bigger in both height and width look much bigger than the numbers they show.
- A pie chart must show the whole group, so its percentages must add to 100%.
- A claim can only be trusted if the data comes from the right group of people, the sample is big enough, and whoever made the claim isn't biased.
What your child will practise:
- Identifying broken axes, uneven scales and pictures not drawn to scale.
- Checking whether a pie chart or percentage claim adds up.
- Deciding whether a sample matches the claim being made.
- Spotting leading survey questions and exaggerated wording.
- Using calculations to test a claim.
Every section opens with a worked example, and the download includes a full answer key with step-by-step solutions and teaching notes on the mistakes students most commonly make.