
This worksheet builds data literacy, teaching students to read and describe relationships between two related quantities from a graph or table of authentic data. The worksheet is split into warm-up questions, standard questions and then extension questions to test you.
The concepts it covers:
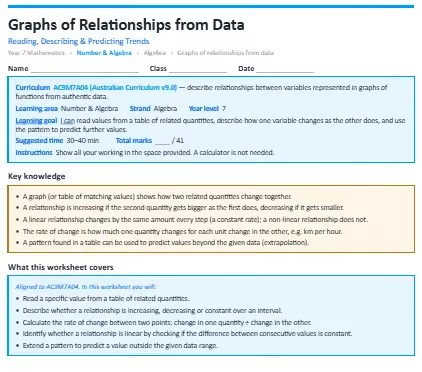
- A graph (or table of matching values) shows how two related quantities change together.
- A relationship is increasing if the second quantity gets bigger as the first does, decreasing if it gets smaller.
- A linear relationship changes by the same amount every step (a constant rate); a non-linear relationship does not.
- The rate of change is how much one quantity changes for each unit change in the other, e.g. km per hour.
- A pattern found in a table can be used to predict values beyond the given data (extrapolation).
What your child will practise:
- Reading a specific value from a table of related quantities.
- Describing whether a relationship is increasing, decreasing or constant over an interval.
- Calculating the rate of change between two points: change in one quantity ÷ change in the other.
- Identifying whether a relationship is linear by checking if the difference between consecutive values is constant.
- Extending a pattern to predict a value outside the given data range.
Every section opens with a worked example, and the download includes a full answer key with step-by-step solutions and teaching notes on the mistakes students most commonly make.
.webp)


.webp)
%20(1).webp)

