
This worksheet introduces the statistical investigation process, teaching students to plan an investigation, identify sources of bias in data collection, and interpret data to draw a justified conclusion. The worksheet is split into warm-up questions, standard questions and then extension questions to test you.
The concepts it covers:
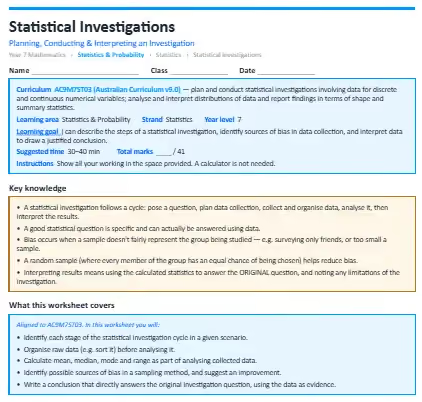
- A statistical investigation follows a cycle: pose a question, plan data collection, collect and organise data, analyse it, then interpret the results.
- A good statistical question is specific and can actually be answered using data.
- Bias occurs when a sample doesn't fairly represent the group being studied — e.g. surveying only friends, or too small a sample.
- A random sample (where every member of the group has an equal chance of being chosen) helps reduce bias.
- Interpreting results means using the calculated statistics to answer the original question, and noting any limitations of the investigation.
What your child will practise:
- Identifying each stage of the statistical investigation cycle in a given scenario.
- Organising raw data (e.g. sort it) before analysing it.
- Calculating mean, median, mode and range as part of analysing collected data.
- Identifying possible sources of bias in a sampling method, and suggest an improvement.
- Writing a conclusion that directly answers the original investigation question, using the data as evidence.
Every section opens with a worked example, and the download includes a full answer key with step-by-step solutions and teaching notes on the mistakes students most commonly make.
.webp)


.webp)
%20(1).webp)

